Unlock a world of possibilities! Login now and discover the exclusive benefits awaiting you.
- Qlik Community
- :
- Forums
- :
- Analytics
- :
- New to Qlik Analytics
- :
- Re: Barchart showing incorrect color
- Subscribe to RSS Feed
- Mark Topic as New
- Mark Topic as Read
- Float this Topic for Current User
- Bookmark
- Subscribe
- Mute
- Printer Friendly Page
- Mark as New
- Bookmark
- Subscribe
- Mute
- Subscribe to RSS Feed
- Permalink
- Report Inappropriate Content
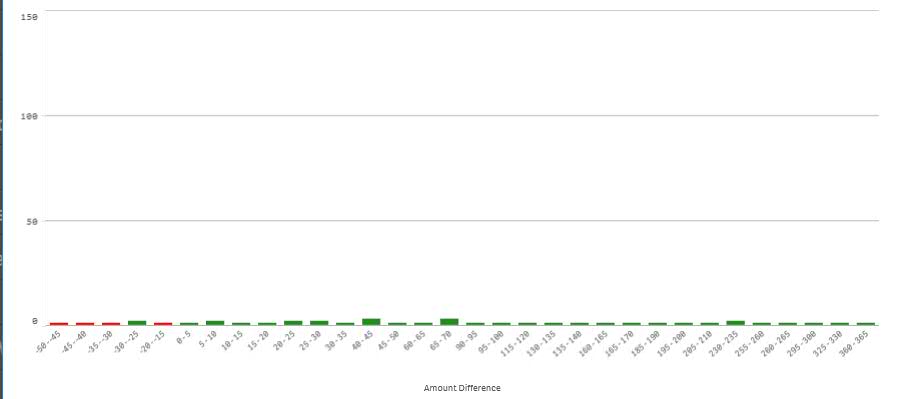
Barchart showing incorrect color
This is my condition which i am using for color by expression .If(DIFF_AMOUNT < 0,RGB(255,0,0),RGB(34,139,34))
However my graph shows a wrong color (ie green) in the -30 to -25 range, when in fact should be red.
Thanks in advance,
Cheers,
Tanay
- Tags:
- qliks sense*
- « Previous Replies
-
- 1
- 2
- Next Replies »
- Mark as New
- Bookmark
- Subscribe
- Mute
- Subscribe to RSS Feed
- Permalink
- Report Inappropriate Content
Please share your app
- Mark as New
- Bookmark
- Subscribe
- Mute
- Subscribe to RSS Feed
- Permalink
- Report Inappropriate Content
Yeah , I have the column "diff amount" which has the values,both positive and negative. The idea is ,depending upon that whether it is positive or negative i want to give color to my graph as red or green.but while the entire graph is coming correct, only for the range of -25 to -30 i am getting the wrong color. So not sure whether, its' a bug in qlik sense or a mistake from my end.
- Mark as New
- Bookmark
- Subscribe
- Mute
- Subscribe to RSS Feed
- Permalink
- Report Inappropriate Content
If(sum("diff amount" )<0,RGB(255,0,0),RGB(34,139,34))
Try this, even after if it is giving same color then check the result sum value generated for -25 to -30 range so that you will know what is issue there. If it is negative then it is fine else you need to check the data available in that range.
As far as I know, color by expression is working properly in Qlik sense.
Note: "diff amount" - is the fields used to generate those intervals.
- Mark as New
- Bookmark
- Subscribe
- Mute
- Subscribe to RSS Feed
- Permalink
- Report Inappropriate Content
I thought DIFF_AMOUNT is the dimension of barchart.
then replace DIFF_AMOUNT with your dimension name
If(left(dimensionname,1)='-',RGB(255,0,0),RGB(34,139,34))
- Mark as New
- Bookmark
- Subscribe
- Mute
- Subscribe to RSS Feed
- Permalink
- Report Inappropriate Content
Hi Rajesh,
It is not possible to share my app but if you need any other information in addition to what i have provided above, kindly let me know
- « Previous Replies
-
- 1
- 2
- Next Replies »