Unlock a world of possibilities! Login now and discover the exclusive benefits awaiting you.
- Qlik Community
- :
- Forums
- :
- Analytics
- :
- New to Qlik Analytics
- :
- Re: How to show all months in a line chart
- Subscribe to RSS Feed
- Mark Topic as New
- Mark Topic as Read
- Float this Topic for Current User
- Bookmark
- Subscribe
- Mute
- Printer Friendly Page
- Mark as New
- Bookmark
- Subscribe
- Mute
- Subscribe to RSS Feed
- Permalink
- Report Inappropriate Content
How to show all months in a line chart
Hello!
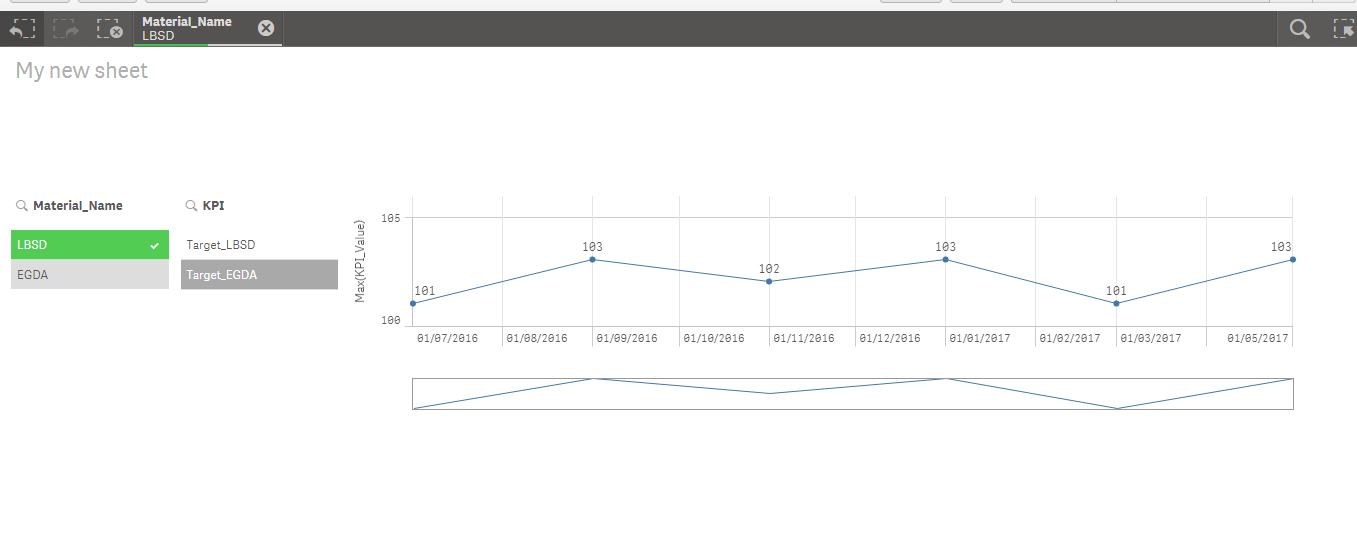
I have two tables - one with KPI data and another one with invoice data. The tables are linked on Material and Month. The KPI table has data for each month while the invoice data is missing for some months. What I want is a line chart with KPI and KPI_Month as dimensions and Max(KPI_Value) as measure. After selecting a material, the chart should display the associated KPI for all months and not only for the months with invoice data. Please see the gif below and notice how some months disappear after a material gets selected:
Here is the sample data:
KPI:
LOAD
KPI,
KPI_Value,
DATE(DATE#(KPI_Month, 'MM.YYYY')) AS KPI_Month,
// Material
Material & '-' & DATE(DATE#(KPI_Month, 'MM.YYYY')) AS Material_Month_Key
INLINE [
KPI,KPI_Value,KPI_Month,Material
Target_LBSD,101,07.2016,5000
Target_LBSD,102,08.2016,5000
Target_LBSD,103,09.2016,5000
Target_LBSD,104,10.2016,5000
Target_LBSD,102,11.2016,5000
Target_LBSD,104,12.2016,5000
Target_LBSD,103,01.2017,5000
Target_LBSD,102,02.2017,5000
Target_LBSD,101,03.2017,5000
Target_LBSD,102,04.2017,5000
Target_LBSD,103,05.2017,5000
Target_LBSD,104,06.2017,5000
Target_EGDA,106,07.2016,6000
Target_EGDA,107,08.2016,6000
Target_EGDA,108,09.2016,6000
Target_EGDA,106,10.2016,6000
Target_EGDA,108,11.2016,6000
Target_EGDA,108,12.2016,6000
Target_EGDA,109,01.2017,6000
Target_EGDA,107,02.2017,6000
Target_EGDA,108,03.2017,6000
Target_EGDA,109,04.2017,6000
Target_EGDA,120,05.2017,6000
Target_EGDA,106,06.2017,6000
];


Data:
LOAD
Material AS Material_ID,
Material_Name,
DATE(DATE#(Invoice_Month, 'MM.YYYY')) AS Invoice_Month,
Invoice_Value,
Invoice_Quantity,
Material & '-' & DATE(DATE#(Invoice_Month, 'MM.YYYY')) AS Material_Month_Key
INLINE [
Material,Material_Name,Invoice_Month,Invoice_Value,Invoice_Quantity
5000,LBSD,07.2016,150,2500
5000,LBSD,09.2016,140,2500
5000,LBSD,11.2016,130,2500
5000,LBSD,01.2017,145,2500
5000,LBSD,03.2017,155,2500
5000,LBSD,05.2017,150,2500
6000,EGDA,07.2016,160,2900
6000,EGDA,08.2016,180,2900
6000,EGDA,12.2016,150,2900
6000,EGDA,01.2017,155,2900
6000,EGDA,04.2017,165,2900
6000,EGDA,05.2017,170,2900
];
This should not be too complicated but I was not able to figure it out. I hope somebody has an idea.
Thank you! 
- « Previous Replies
-
- 1
- 2
- Next Replies »
- Mark as New
- Bookmark
- Subscribe
- Mute
- Subscribe to RSS Feed
- Permalink
- Report Inappropriate Content
What do you mean that it does not exist? KPI_Month has a value for each month.
The Month from the other table has values only for some of the months.
- Mark as New
- Bookmark
- Subscribe
- Mute
- Subscribe to RSS Feed
- Permalink
- Report Inappropriate Content
I am using the data provided by you and for the selection which you made it is showing me like this.
- Mark as New
- Bookmark
- Subscribe
- Mute
- Subscribe to RSS Feed
- Permalink
- Report Inappropriate Content
Yes, you get exactly the same result as me. Please compare to the gif in the first post. After a material is selected you end up with a graph showing only six values:
07.2016
09.2016
11.2016
01.2017
03.2017
05.2017
The data for the other six months is missing.
- Mark as New
- Bookmark
- Subscribe
- Mute
- Subscribe to RSS Feed
- Permalink
- Report Inappropriate Content
Hi Mikel,
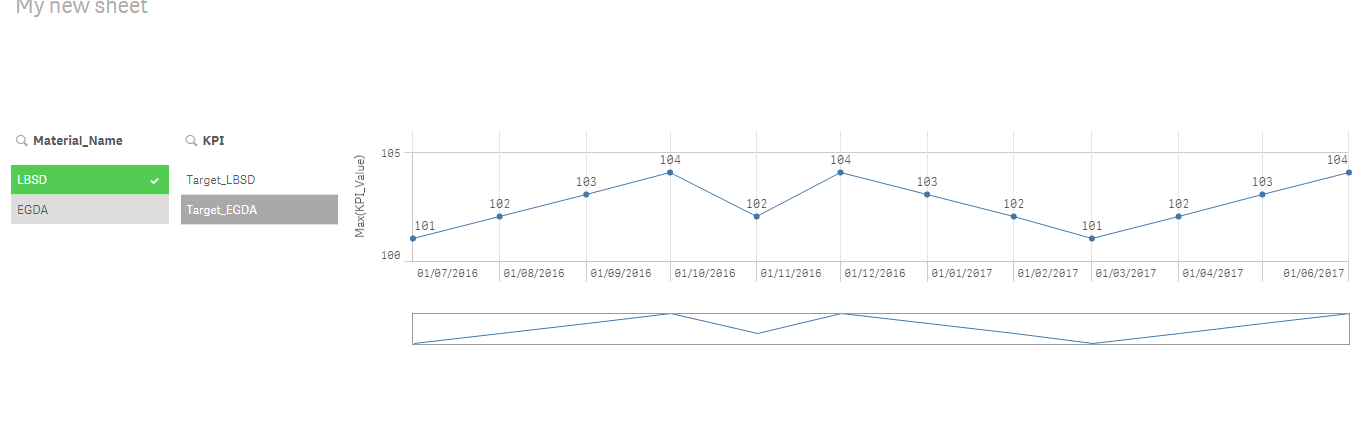
The association was not correct.
I modified the code.
KPI:
LOAD
KPI,
KPI_Value,
DATE(DATE#(KPI_Month, 'MM.YYYY')) AS KPI_Month,
Material as Material_ID
//Material & '-' & DATE(DATE#(KPI_Month, 'MM.YYYY')) AS Material_Month_Key
INLINE [
KPI,KPI_Value,KPI_Month,Material
Target_LBSD,101,07.2016,5000
Target_LBSD,102,08.2016,5000
Target_LBSD,103,09.2016,5000
Target_LBSD,104,10.2016,5000
Target_LBSD,102,11.2016,5000
Target_LBSD,104,12.2016,5000
Target_LBSD,103,01.2017,5000
Target_LBSD,102,02.2017,5000
Target_LBSD,101,03.2017,5000
Target_LBSD,102,04.2017,5000
Target_LBSD,103,05.2017,5000
Target_LBSD,104,06.2017,5000
Target_EGDA,106,07.2016,6000
Target_EGDA,107,08.2016,6000
Target_EGDA,108,09.2016,6000
Target_EGDA,106,10.2016,6000
Target_EGDA,108,11.2016,6000
Target_EGDA,108,12.2016,6000
Target_EGDA,109,01.2017,6000
Target_EGDA,107,02.2017,6000
Target_EGDA,108,03.2017,6000
Target_EGDA,109,04.2017,6000
Target_EGDA,120,05.2017,6000
Target_EGDA,106,06.2017,6000
];
Data:
LOAD
Material AS Material_ID,
Material_Name,
DATE(DATE#(Invoice_Month, 'MM.YYYY')) AS Invoice_Month,
Invoice_Value,
Invoice_Quantity
//Material & '-' & DATE(DATE#(Invoice_Month, 'MM.YYYY')) AS Material_Month_Key
INLINE [
Material,Material_Name,Invoice_Month,Invoice_Value,Invoice_Quantity
5000,LBSD,07.2016,150,2500
5000,LBSD,09.2016,140,2500
5000,LBSD,11.2016,130,2500
5000,LBSD,01.2017,145,2500
5000,LBSD,03.2017,155,2500
5000,LBSD,05.2017,150,2500
6000,EGDA,07.2016,160,2900
6000,EGDA,08.2016,180,2900
6000,EGDA,12.2016,150,2900
6000,EGDA,01.2017,155,2900
6000,EGDA,04.2017,165,2900
6000,EGDA,05.2017,170,2900
];
Now , look at the output
- Mark as New
- Bookmark
- Subscribe
- Mute
- Subscribe to RSS Feed
- Permalink
- Report Inappropriate Content
Hi,
Thank you very much, I appreciate your time! Is there any way to do this in the front end? I would prefer not to change the script because:
1) this is not my app and it will take time to implement the change
2) the data model is much larger than 2 tables and changing this will make other amendments necessary
Thanks!
- Mark as New
- Bookmark
- Subscribe
- Mute
- Subscribe to RSS Feed
- Permalink
- Report Inappropriate Content
Association in your script is based on the Material Month Key which on KPI table has Kpi_month and on the Data table has Invoice Month.
As far as I can think if the data model is not correct then bypassing it and showing the different result in the front end is difficult. Either you have to correct the association or add a master calendar in your script so that KPIs pertaining to every date is possible or you can try a data island for your desired date.
I tried 'calculated dimension' using valueloop() function but it did not give the correct result.
- Mark as New
- Bookmark
- Subscribe
- Mute
- Subscribe to RSS Feed
- Permalink
- Report Inappropriate Content
I see what you mean, there is no Material_Month_Key value associated to the materials when an Invoice_Month is missing. This screws up my graph after a selection has been made.
I was hoping that there is anything possible on the front end, e.g. some kind of set analysis that will "fix" the dimension of the line chart. Thank you for your help, I will keep trying without changing the script for the moment.
- « Previous Replies
-
- 1
- 2
- Next Replies »