Unlock a world of possibilities! Login now and discover the exclusive benefits awaiting you.
- Qlik Community
- :
- Forums
- :
- Analytics
- :
- New to Qlik Analytics
- :
- Re: show more than 200 original tables in one pivo...
- Subscribe to RSS Feed
- Mark Topic as New
- Mark Topic as Read
- Float this Topic for Current User
- Bookmark
- Subscribe
- Mute
- Printer Friendly Page
- Mark as New
- Bookmark
- Subscribe
- Mute
- Subscribe to RSS Feed
- Permalink
- Report Inappropriate Content
show more than 200 original tables in one pivot tables or other tables
Hello everyone, please help to explain the case below.
There are many tables, more than 200 or more, and we need to show the original table.
The amount of data per table is not very large, the largest six million rows, followed by more than one million rows.
And when selecting the table name, we need to show the fields and data of the selected table.
We don't want to do more than 200 pivot tables or tables,how do we show them in one table?
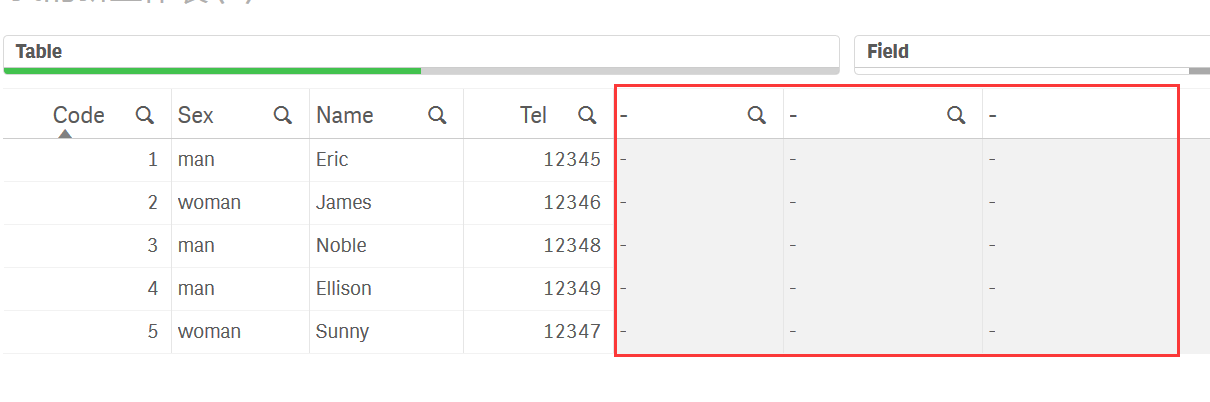
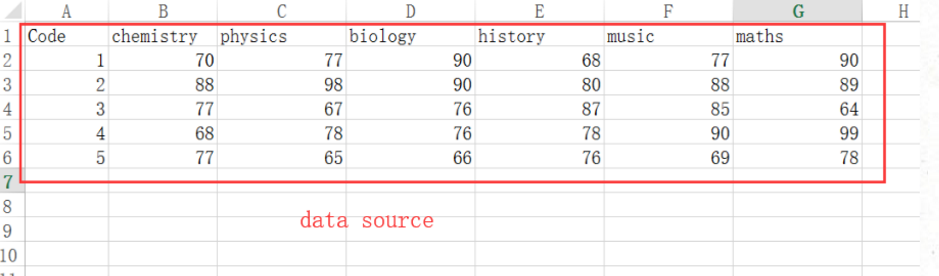
Example:there are two tables:score and student.When selecting the score table, the fields and data of the score table are displayed

In the data source, that's what the data in the excel table looks like
When the table is selected as the student table, the table fields and data of the student table are displayed
![)E8~PW1PGUN6]1VZ78W7XY9.png](/legacyfs/online/208737_)E8~PW1PGUN6]1VZ78W7XY9.png)
In the data source, that's what the data in the excel table looks like

- Mark as New
- Bookmark
- Subscribe
- Mute
- Subscribe to RSS Feed
- Permalink
- Report Inappropriate Content
I think you have to do a metamodel of your data :
for each source :
make a table with name of source (score, student .....) and field that are in this source
SourceName,FieldDisplay for example
then in front end,
choose a source in a listbox,
and then in expression fieldvalue('FieldDisplay', 'the order of your column)
regards
- Mark as New
- Bookmark
- Subscribe
- Mute
- Subscribe to RSS Feed
- Permalink
- Report Inappropriate Content
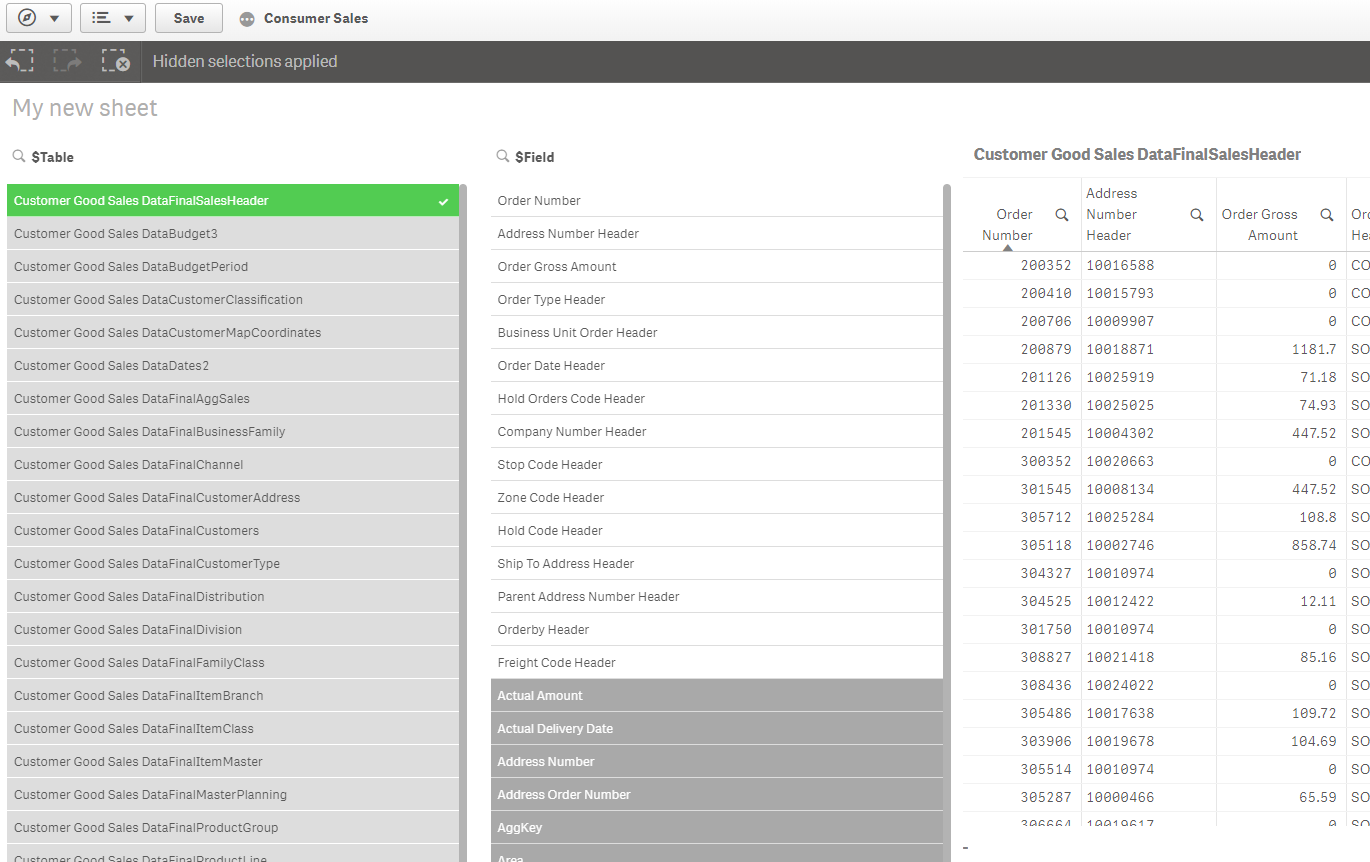
You can create a dynamic table to view any table in the same UI table just by clicking a single tablename from a list of all the tables in your datamodel:
Add two fields to a Filter Pane: $Table and $Field. They are both system fields that normally don't show up on a list of fields but can be used as normal fields anyway.
Create a table with as many dimensions as the max number of fields any given table might have. For each dimension you add an expression instead of a field name along this pattern:
=[$(=FirstSortedValue($Field,$FieldNo,1))]
and label should be:
='$(=FirstSortedValue($Field,$FieldNo,1))'
You substitue the number 1 with 2 for the second column/dimension and 3 for the third and so forth.
Slightly better might be to do this:
To simplify the construction of the dimension you could create a variable that takes a parameter and then use that variable-function which is quicker and easier to input into each expression for each dimension:
vCol
=[$(=FirstSortedValue($Field,$FieldNo,$1))]
Then for each column/dimension you could have expressions like this:
=$(vCol(1))
for the first dimension and
=$(vCol(2))
for the second and so forth....
- Mark as New
- Bookmark
- Subscribe
- Mute
- Subscribe to RSS Feed
- Permalink
- Report Inappropriate Content
thank you very much,
but there is a problem,
What is the maximum column shown in the table.
The table I'm going to show is over 200 columns.
I find the table doesn't seem to work.
And many columns that this table does not have columns but other tables doare shown as “-”,
Is there any way to hide it