Unlock a world of possibilities! Login now and discover the exclusive benefits awaiting you.
- Qlik Community
- :
- All Forums
- :
- QlikView App Dev
- :
- Re: Setting a status based on rows within a dimens...
- Subscribe to RSS Feed
- Mark Topic as New
- Mark Topic as Read
- Float this Topic for Current User
- Bookmark
- Subscribe
- Mute
- Printer Friendly Page
- Mark as New
- Bookmark
- Subscribe
- Mute
- Subscribe to RSS Feed
- Permalink
- Report Inappropriate Content
Setting a status based on rows within a dimension
I’m trying to figure something out that seems complicated toexplain, but I’ll give it a try. My goal is to look at a table with multipledimensions and assign “Green” and “Red” statuses at the various dimensionlevels.
Each row has a Value, and let’s say that if the number ispositive it’s Green and if it is not it is Red.
Each row has three dimensions, D1 being the highest rollupdimension, D2 the next down, and D3 being the lowest rollup dimension.
Each Dimension is scored as follows:
D3 (lowest) is green if the number of green rows is greaterthan the number of red rows.
D2 (middle) is green if the number of D3 green rows isgreater than the number of D3 red rows.
D1 (top) is green if the number of D2 green rows is greaterthan the number of D3 red rows.
So, what I’m looking for is some sort of function that tellsme the number of D3 rows in each D2, each D2 in each D1, etc.
The actual "green" and "red" aren't as important (that is, I can display these statuses in multiple ways if I wish), but I don't know how to set up a set of drill-down charts that will show me the needed Green and Red status at the various levels.
If there is a way to implement this solely through existing QV functions, that would be best, but naturally if it is primarily a scripting solution, that would be OK too.
Thanks everyone for your help!
- « Previous Replies
- Next Replies »
Accepted Solutions
- Mark as New
- Bookmark
- Subscribe
- Mute
- Subscribe to RSS Feed
- Permalink
- Report Inappropriate Content
Here's the solution (see attached)
Based on a hierarchty Level 3 (lowest level), Level 2 Level 1 (highest). Field status is set to Bad if the value is zero or below, Good if the status is above zero.
The expressions for each of the levels status indicators are:
Level 3:
If(Sum({<Status={'Bad'}>} RecCount) < Sum({<Status={'Good'}>} RecCount), 'qmem://<bundled>/BuiltIn/led_g.png', 'qmem://<bundled>/BuiltIn/led_r.png')
(Pretty straightfoward)
Level 2:
If(Sum(Total <Level1, Level2> Aggr(
If(Sum({<Status={'Bad'}>} RecCount) >= Sum({<Status={'Good'}>} RecCount), -1, 1), Level1, Level2, Level3)) > 0,
'qmem://<bundled>/BuiltIn/led_g.png', 'qmem://<bundled>/BuiltIn/led_r.png')
(Level 3 expression in Aggr, adding 1 for good and subtracting 1 for bad, and comparing the results with zero)
Level 1:
If(Sum(Total <Level1>
Aggr(
If(Sum(Total <Level1, Level2> Aggr(
If(Sum({<Status={'Bad'}>} RecCount) >= Sum({<Status={'Good'}>} RecCount), -1, 1), Level1, Level2, Level3)) > 0, 1, -1)
Level1, Level2, Level3)) > 0,
'qmem://<bundled>/BuiltIn/led_g.png', 'qmem://<bundled>/BuiltIn/led_r.png')
(Level 2 xpression in Aggr, adding 1 for good and subtracting 1 for bad, and comparing the results with zero)
I have tested this quite carefuly and I am confident that it works.
Regards
Jonathan
- Mark as New
- Bookmark
- Subscribe
- Mute
- Subscribe to RSS Feed
- Permalink
- Report Inappropriate Content
Hi
Let's assume that you have a straight table with D1, D2, D3 and Value as dimensions -
Expression: ValueStatus
=If(Sum(Value) >= 0, 'Green', 'Red')
Expression: D3 status
=If(Count({<Value={">=0"}>} total <D1,D2,D3> Value) >= Count({<Value={"<0"}>} total <D1,D2,D3> Value), 'Green', 'Red')
Expression: D2 status
=If(Count({<Value={">=0"}>} total <D1,D2> Value) >= Count({<Value={"<0"}>} total <D1,D2> Value), 'Green', 'Red')
Expression: D1 status
If(Count({<Value={">=0"}>} total <D1> Value) >= Count({<Value={"<0"}>} total <D1> Value), 'Green', 'Red')
See the attached file as an example.
Hope that helps
Jonathan
- Mark as New
- Bookmark
- Subscribe
- Mute
- Subscribe to RSS Feed
- Permalink
- Report Inappropriate Content
In your sample above, do D1, D2, D3 represent the FIELD NAMES or Field Values?
Since D1 status is dependant upon the cumulative of D2s that make it up, shouldn't the last expression be:
Expression: D1 status
If(Count({<Value={">=0"}>} total <D2> Value) >= Count({<Value={"<0"}>}
      total <D2> Value), 'Green', 'Red')
Still working with this, but I need to understand these expressions. Thanks for the help!
- Mark as New
- Bookmark
- Subscribe
- Mute
- Subscribe to RSS Feed
- Permalink
- Report Inappropriate Content
Hi
r316811r wrote:
In your sample above, do D1, D2, D3 represent the FIELD NAMES or Field Values?
Field names
r316811r wrote:
Since D1 status is dependant upon the cumulative of D2s that make it up, shouldn't the last expression be:
Expression: D1 statusIf(Count({<Value={">=0"}>} total <D2> Value) >= Count({<Value={"<0"}>}
total <D2> Value), 'Green', 'Red')
I don't think so - as the count of D1 records (top level of hierarchy) is the same regardless of the D2 records. The count at the top level does not matter how the lower levels are structured.This is in contrast with D3, at the lowest level of the hierarchy, where the reference is only relevant within the context of a specific D1 and D2.
Hope that helps to clarify the expressions
Jonathan
- Mark as New
- Bookmark
- Subscribe
- Mute
- Subscribe to RSS Feed
- Permalink
- Report Inappropriate Content
OK, I'm beginning to understand, but I don't think this is it, just yet. I'm going to be attaching a QV document that will show what I'm doing, but this image will help, 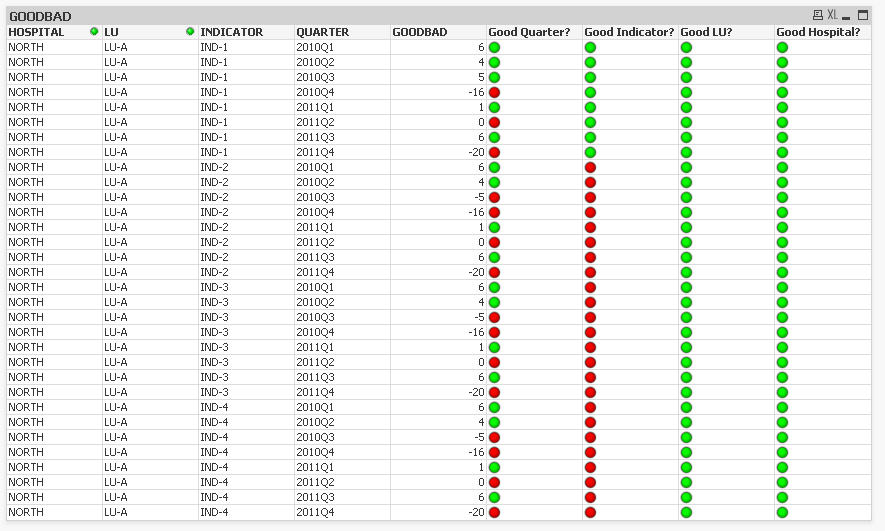
Notice the red and green indicators. The first column is based on the value of GOODBAD. the 2nd column should be based on the red/green status in the first column and actually seems to work. However, the third and fourth columns should be red, because the LU's have more red indicators than Green, and the Hospital column should also be red because it has more red LUs than green.
I think that the expressions you have given to me take their status based on the lowest levels (quarters) not the immedialy lower down levels.
Does this make sense?
- Mark as New
- Bookmark
- Subscribe
- Mute
- Subscribe to RSS Feed
- Permalink
- Report Inappropriate Content
Hi
The third and fourth column look correct to me - you have 17 green and 15 red indicators in the first column. From your initial post I understood that to mean if there were more green than red in the first then the result should be green.
Perhaps I have not fully understood your requirement.
Jonathan
- Mark as New
- Bookmark
- Subscribe
- Mute
- Subscribe to RSS Feed
- Permalink
- Report Inappropriate Content
Thanks for your continued help.
Sorry, I have not explained it well enough. The 3rd column should be based on the 2nd column (that is, in this case, there are more red Indicaters than green in the 2nd column, so column 3 should be red); and the 4th column should be based on the 3rd column in a similar fashion.
So, in the image, you can see that the column for Indicators (column 2) looks good. Column 3 (LU's) consists of four Indicators in column 2 (IND-1, IND-2, IND-3, IND-4). IND-1 is green, but the other three are red, so LU-A should be coded as red, since there are more red Indicators than green Indicators.
Again, thanks for your patience; imagine how difficult this was getting the requirements out of the user!
- Mark as New
- Bookmark
- Subscribe
- Mute
- Subscribe to RSS Feed
- Permalink
- Report Inappropriate Content
Ok
I get the problem. Have a look at the attached - I think its what you are after. I created two hidden columns to track the number of greens and reds and use the counts of the hidden columns to ensure that each level uses the previous level's green/red count, rather than the base level green/red count.
Unfortunately your test data appears not to have LU;s and hospitals that come out green, so I can't be sure that it is working, but it seems to be OK.
Regards
Jonathan
- Mark as New
- Bookmark
- Subscribe
- Mute
- Subscribe to RSS Feed
- Permalink
- Report Inappropriate Content
I assure you, I am pouring over your suggestions and cracking my brains. I'm not sure how this new version will work, since I see the following 'bad field name(s)' errors when you reference T1 and T2 in the expressions:
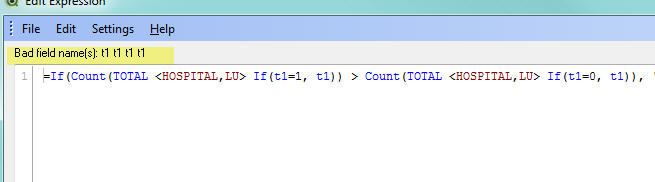
I see where you're going with this, but will this work, since t1 and t2 aren't fields in the table?
I attached the input data so you can play around with it...I simplified this version, just one hospital and one LU.
As always, I really appreciate your help.
- Mark as New
- Bookmark
- Subscribe
- Mute
- Subscribe to RSS Feed
- Permalink
- Report Inappropriate Content
Qlikview sometimes is a little overzealous in indicating syntax errors in script/expressions and bad field names in expressions. They are 'bad' because they are not field names, but column references. You could replace t1/t2 with column(n), ir referencing the column by number rather than by name.
Jonathan
- « Previous Replies
- Next Replies »