Unlock a world of possibilities! Login now and discover the exclusive benefits awaiting you.
- Qlik Community
- :
- Forums
- :
- Analytics
- :
- New to Qlik Analytics
- :
- Re: New to QlikSense - lagged value in line chart
- Subscribe to RSS Feed
- Mark Topic as New
- Mark Topic as Read
- Float this Topic for Current User
- Bookmark
- Subscribe
- Mute
- Printer Friendly Page
- Mark as New
- Bookmark
- Subscribe
- Mute
- Subscribe to RSS Feed
- Permalink
- Report Inappropriate Content
New to QlikSense - lagged value in line chart
Hi All,
Just started QlikSense this week, have a query. I have a line chart of total accounts # where "number of accounts" originated from a particular Quarter (example 2015 Q4, 2016 Q1, 2016 Q2 etc.) is shown per "Month on Book" (0,1,2,3 etc.) . So my line chart is simply below which has two dimensions: QTR_VINTAGE and MOB.
SUM([ACCOUNTS]).
In the Chart, number of accounts originated from a specific vintage is plotted per "Month on Book".
Now my requirement is for Month on Book = 1, I want to show the value from "Month on Book" when 0 which is one point prior. For MOB=0, it should keep the same value. From MOB=1 onwards it should plot one lagged value that is, from (MOB-1).
I can do this easily in Data and load it to show in Chart but I really want to handle this using function/script in Qlik Sense itself. Can you please advise?
Cheers,
Ayan
- Mark as New
- Bookmark
- Subscribe
- Mute
- Subscribe to RSS Feed
- Permalink
- Report Inappropriate Content
Could you illustrate what you mean in a spreadsheet? It might be easier to understand the logic that way....
- Mark as New
- Bookmark
- Subscribe
- Mute
- Subscribe to RSS Feed
- Permalink
- Report Inappropriate Content
May be try like this:
ABC:
LOAD * INLINE
[
CITY, CITY_SALARY
New York, 12220.56
Toronto, 1234.56
Vancouver, 19118.9
];
Temp1:
LOAD *,RowNo() as RN Resident ABC;
Temp2:
LOAD
CITY,
CITY_SALARY,
Peek(CITY_SALARY) as LEAD
Resident Temp1
Order By RN DESC;
Temp3:
LOAD
CITY,
CITY_SALARY,
Peek(CITY_SALARY) as LAG
Resident Temp1
Order By RN ASC;
NoConcatenate
Result:
LOAD CITY,CITY_SALARY,LEAD Resident Temp2;
Inner Join
LOAD CITY,LAG Resident Temp3;
DROP Tables ABC,Temp1,Temp2,Temp3;
Result Table
CITY CITY_SALARY LAG LEAD
New York 12220.56 1234.56
Toronto 1234.56 12220.56 19118.9
Vancouver 19118.9 1234.56
Check this:
- Mark as New
- Bookmark
- Subscribe
- Mute
- Subscribe to RSS Feed
- Permalink
- Report Inappropriate Content
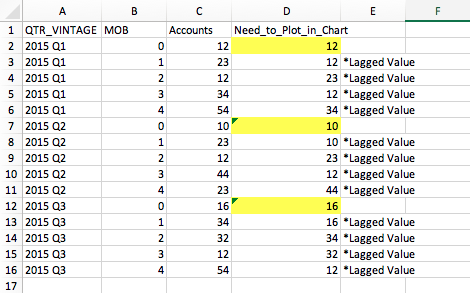
Hi, like this last column D, I need to plot for each column "A" values per MOB on X Axis. The MOB=0 value is plotted without any transformation but MOB=1 onwards it is one value lagged. Hope this clarifies.
Thanks,
Ayan
- Mark as New
- Bookmark
- Subscribe
- Mute
- Subscribe to RSS Feed
- Permalink
- Report Inappropriate Content
Hi Bala,
Will try and let you know.
Thanks,
Ayan
- Mark as New
- Bookmark
- Subscribe
- Mute
- Subscribe to RSS Feed
- Permalink
- Report Inappropriate Content
Actually, I was also trying to see if there is any direct function I can use in the chart script directly. Because I am anyway creating data outside and feeding into the project. I can always create a lagged variable in data; I am trying to find out if there is a way it can be coded up directly in the chart scripting.
Thanks!
Ayan
- Mark as New
- Bookmark
- Subscribe
- Mute
- Subscribe to RSS Feed
- Permalink
- Report Inappropriate Content
Update. I ended up using data load editor.  Code below.
NoConcatenate
Temp1:
LOAD
[QTR_VINTAGE],[MOB],sum([ACCOUNTS]) as sum_accounts
Resident SummaryRaw
group by [QTR_VINTAGE],[MOB];
NoConcatenate
OpenActTable:
LOAD *,
Num(if(QTR_VINTAGE = Previous(QTR_VINTAGE), Previous(sum_accounts), sum_accounts),'############') as open_accounts
Resident Temp1
Order by [QTR_VINTAGE],[MOB];
Drop table Temp1;