Unlock a world of possibilities! Login now and discover the exclusive benefits awaiting you.
- Qlik Community
- :
- Forums
- :
- Analytics
- :
- New to Qlik Analytics
- :
- Re: Qlik Sense: Cyclic Group in Straight Table
- Subscribe to RSS Feed
- Mark Topic as New
- Mark Topic as Read
- Float this Topic for Current User
- Bookmark
- Subscribe
- Mute
- Printer Friendly Page
- Mark as New
- Bookmark
- Subscribe
- Mute
- Subscribe to RSS Feed
- Permalink
- Report Inappropriate Content
Qlik Sense: Cyclic Group in Straight Table
Hello All,
I have used Cyclic group in Straight table in QlikView. I want to build the similar chart in Qlik Sense. Can any one please tell me how to achieve it in Qlik Sense?
PFB the image for reference.
- « Previous Replies
-
- 1
- 2
- Next Replies »
Accepted Solutions
- Mark as New
- Bookmark
- Subscribe
- Mute
- Subscribe to RSS Feed
- Permalink
- Report Inappropriate Content
- Mark as New
- Bookmark
- Subscribe
- Mute
- Subscribe to RSS Feed
- Permalink
- Report Inappropriate Content
Hi,
drill down you can achieve.
go to master items left hand side pannel and select master dimension -- add dimensions -- on left top you can see drill down
- Mark as New
- Bookmark
- Subscribe
- Mute
- Subscribe to RSS Feed
- Permalink
- Report Inappropriate Content
You can script like this to create Cyclic group in Qlik Sense:
ABC:
Load * Inline
[
Cyclic_Fields
ID
NAME
REGION
];
Create a dimension like:
=$(=if(GetSelectedCount(Cyclic_Fields)=0,'ID',Only(Cyclic_Fields))).
And check this link, for scripting perspective:
- Mark as New
- Bookmark
- Subscribe
- Mute
- Subscribe to RSS Feed
- Permalink
- Report Inappropriate Content
you can take a look at Cyclic Measures in Qliksense
I hope it helps.
- Mark as New
- Bookmark
- Subscribe
- Mute
- Subscribe to RSS Feed
- Permalink
- Report Inappropriate Content
What I always do is:
Create an inline Table:
load * inline [
DimID, Cyclic Dimension
1, dim1
2, dim2
3, dim3
];
Now in ur sheet, put this newly created Cyclic Dimension field just above ur table.
In ur table, as a dimension, do as follow:
If( DimID=1, YourActualDim1,
If( DimID=2, YourActualDim2,
If( DimID=3, YourActualDim3 )))
Label it as follow: Cyclic Dimension
With that, if u select dim1 in your New Cyclic Dimension filter selection; u'll have in ur straight table :
YourActualDim1 shown with a label : dim1
(so try to name ur inline fields with accurate values)
Hope this was clear and helpful
- Mark as New
- Bookmark
- Subscribe
- Mute
- Subscribe to RSS Feed
- Permalink
- Report Inappropriate Content
Thanks a lot Bala, I will surely try it.
- Mark as New
- Bookmark
- Subscribe
- Mute
- Subscribe to RSS Feed
- Permalink
- Report Inappropriate Content
I checked the link which lead me to few other links and that seem quite useful, as with Cyclic chart I need to toggle the chart with the use of Buttons as well. Quite easy peasy in QlikView but bit dramatic in Sense to achieve it. Still, thank you so much for quick help
- Mark as New
- Bookmark
- Subscribe
- Mute
- Subscribe to RSS Feed
- Permalink
- Report Inappropriate Content
Thanks Omar,
I will try the solution suggested, seems easier.
- Mark as New
- Bookmark
- Subscribe
- Mute
- Subscribe to RSS Feed
- Permalink
- Report Inappropriate Content
I tried and achieved it correctly but I have 2 cyclic dimension groups to be used in the same Chart. Attaching you the pic, can u help?
I developed 2 cyclic dimension Fields correctly in QlikSense by following the steps given and have achieved it but I am not able to use both the newly created Cyclic Dimension in 1 single Dimension.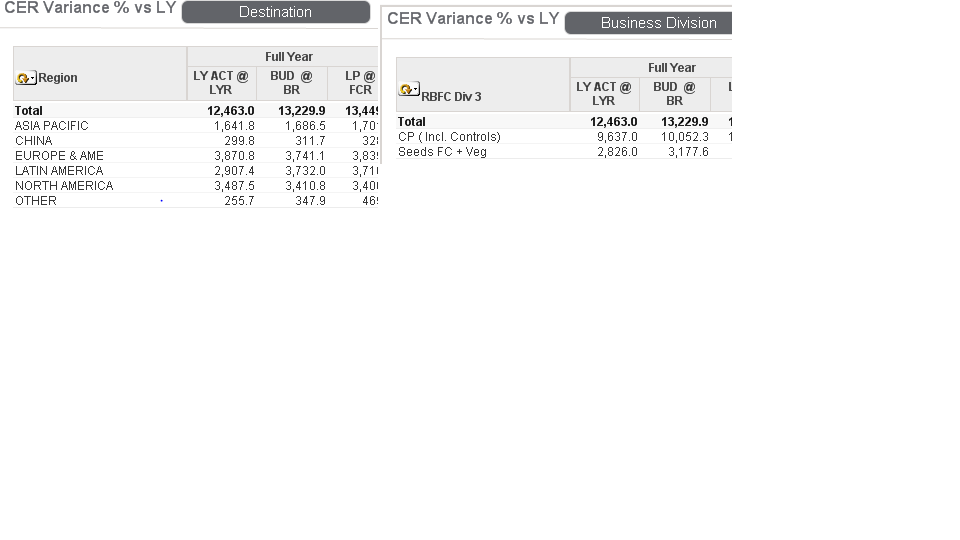
- Mark as New
- Bookmark
- Subscribe
- Mute
- Subscribe to RSS Feed
- Permalink
- Report Inappropriate Content
Yes I created this Sir but I need to use it in Dimension and not in Expression measure. Can you help ?
I tried and achieved it correctly but I have 2 cyclic dimension groups to be used in the same Chart. Attaching you the pic, can u help?
I developed 2 cyclic dimension Fields correctly in QlikSense by following the steps given and have achieved it but I am not able to use both the newly created Cyclic Dimension in 1 single Dimension.
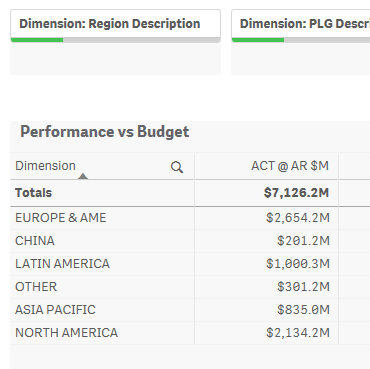
I need the same functionality that we used to have in QlikView Chart Dimension in QS Chart.
QV Screenshot:

QS Screenshot:

- « Previous Replies
-
- 1
- 2
- Next Replies »