Unlock a world of possibilities! Login now and discover the exclusive benefits awaiting you.
- Qlik Community
- :
- Forums
- :
- Analytics
- :
- New to Qlik Analytics
- :
- Re: stacked bar chart with two dimensions and 1 me...
- Subscribe to RSS Feed
- Mark Topic as New
- Mark Topic as Read
- Float this Topic for Current User
- Bookmark
- Subscribe
- Mute
- Printer Friendly Page
- Mark as New
- Bookmark
- Subscribe
- Mute
- Subscribe to RSS Feed
- Permalink
- Report Inappropriate Content
stacked bar chart with two dimensions and 1 mesure
Hi all,
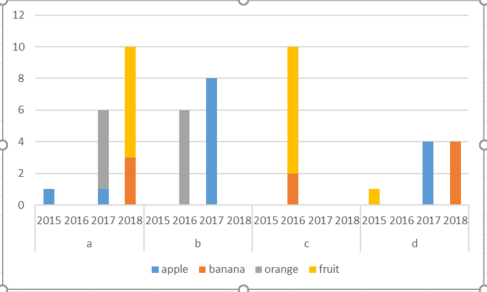
I am having trouble trying to make a stacked bar chart with two dimensions and 1 measure. Any help is appreciated - thank you. I have added the sample data.
This is the sample chart that I want to replicate in Qlik sense:
Accepted Solutions
- Mark as New
- Bookmark
- Subscribe
- Mute
- Subscribe to RSS Feed
- Permalink
- Report Inappropriate Content
Hi !
Here is the solution for you.
I hope it help's you !
Waiting your feedback, good luck.
- Mark as New
- Bookmark
- Subscribe
- Mute
- Subscribe to RSS Feed
- Permalink
- Report Inappropriate Content
Hi !
Here is the solution for you.
I hope it help's you !
Waiting your feedback, good luck.
- Mark as New
- Bookmark
- Subscribe
- Mute
- Subscribe to RSS Feed
- Permalink
- Report Inappropriate Content
wow super, thank you!
2 questions related:
(1) How can I exclude specific variables, for example, I would like to exclude class 'c' or product 'apples' from the chart?
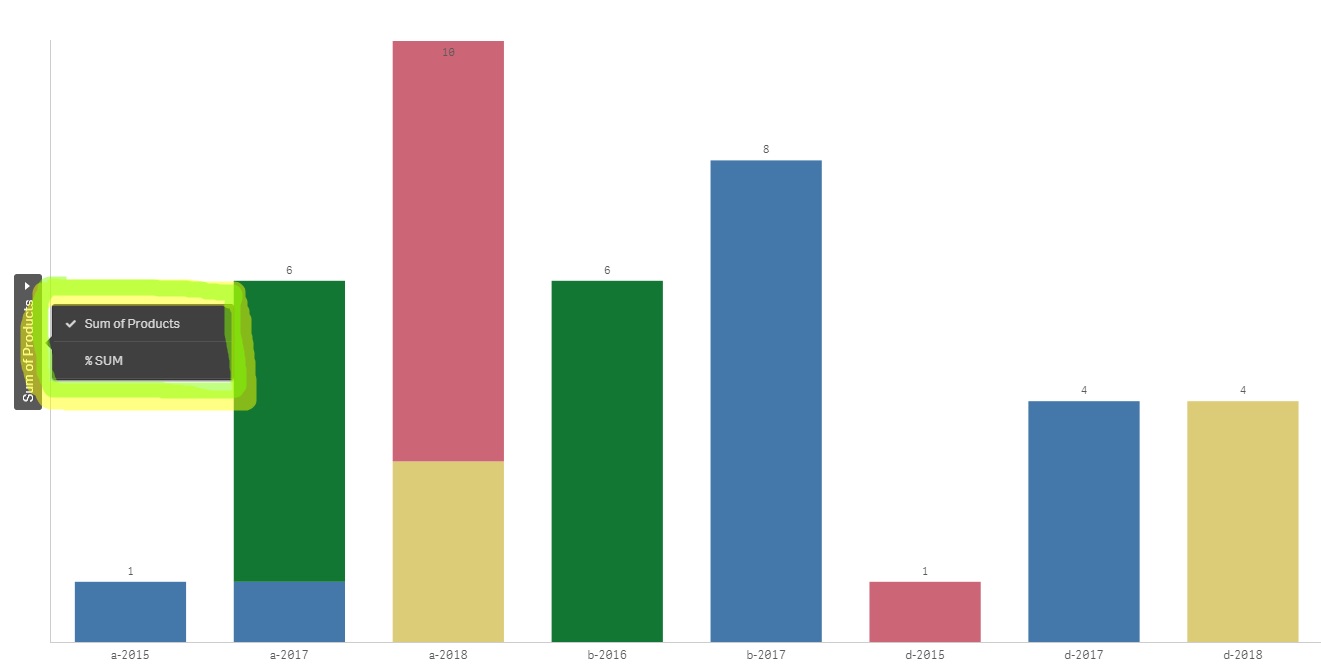
(2) How I can change the chart to 100% stacked bar chart. For example, I want to sum each 'product' in each 'class' and 'year' as a percentage of the in total in the 'class' and 'year'
- Mark as New
- Bookmark
- Subscribe
- Mute
- Subscribe to RSS Feed
- Permalink
- Report Inappropriate Content
Hi, I'm happy to help you.
Here is the .qvf with your two questions, please if my answer resolved your question, don't forget to mark as "Correct Answer".
Look that I've created two metrics.
- Mark as New
- Bookmark
- Subscribe
- Mute
- Subscribe to RSS Feed
- Permalink
- Report Inappropriate Content
Hi Pablo,
I added example.qvf but I cannot find the answers to my two questions.
Can you help me find them please?
- Mark as New
- Bookmark
- Subscribe
- Mute
- Subscribe to RSS Feed
- Permalink
- Report Inappropriate Content
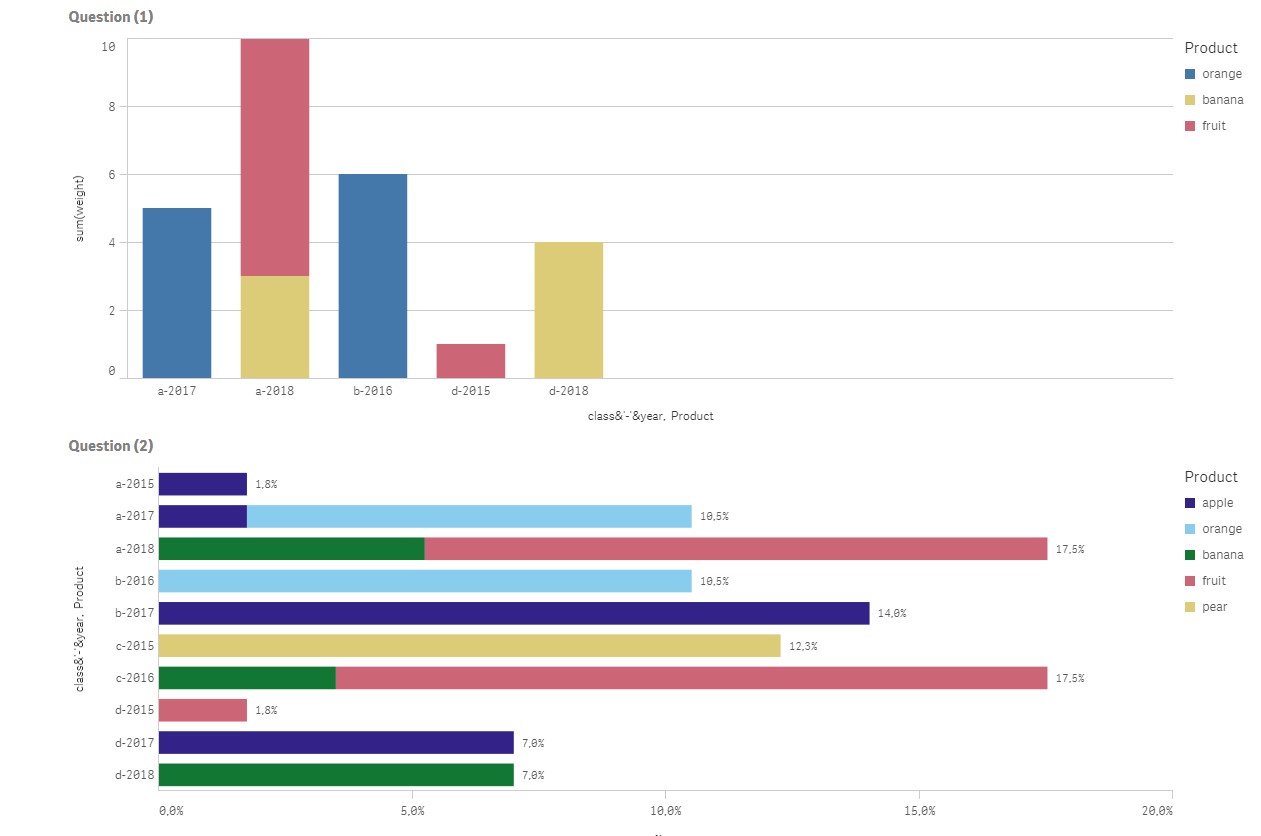
(1) How can I exclude specific variables, for example, I would like to exclude class 'c' or product 'apples' from the chart?
=if(product <> 'apple',product)
(2) How I can change the chart to 100% stacked bar chart. For example, I want to sum each 'product' in each 'class' and 'year' as a percentage of the in total in the 'class' and 'year'
tab1:
LOAD
product,
"class",
weight,
"year",
class&'-'&year as ClassYear
FROM [lib://doc/sample.xlsx]
(ooxml, embedded labels, table is Sheet1);
diments = ClassYear, product
Expresion = sum(weight)/sum(total ClassYear weight)
- Mark as New
- Bookmark
- Subscribe
- Mute
- Subscribe to RSS Feed
- Permalink
- Report Inappropriate Content
Hi,
Sorry, my fault !
Here the correct .qvf
- Mark as New
- Bookmark
- Subscribe
- Mute
- Subscribe to RSS Feed
- Permalink
- Report Inappropriate Content
thank you very much!
Q1: Works really well. Any idea how to sort from largest to smallest i.e. largest stacks are on the bottom?
Q2: I need a 100% stacked bar for each class and year. Can you help me again please?
- Mark as New
- Bookmark
- Subscribe
- Mute
- Subscribe to RSS Feed
- Permalink
- Report Inappropriate Content
(1) How can I exclude multiple objects such as 'apple' in Product and 'c' in Class in one single expression?
(2) I will try this
- Mark as New
- Bookmark
- Subscribe
- Mute
- Subscribe to RSS Feed
- Permalink
- Report Inappropriate Content
2) did not work. No bars appeared at all, the chart is completely blank