Unlock a world of possibilities! Login now and discover the exclusive benefits awaiting you.
- Qlik Community
- :
- All Forums
- :
- QlikView App Dev
- :
- Show all dimension members
- Subscribe to RSS Feed
- Mark Topic as New
- Mark Topic as Read
- Float this Topic for Current User
- Bookmark
- Subscribe
- Mute
- Printer Friendly Page
- Mark as New
- Bookmark
- Subscribe
- Mute
- Subscribe to RSS Feed
- Permalink
- Report Inappropriate Content
Show all dimension members
Hi guys,
I have a DEALER dimension where there are dealers which a set of various KPIs.
I need to count the dealers who have the value of a certain KPI higher than N.
So, I have a table chart.
Dimension: DEALER (in fact I use a DealerArea which aggregates the dealers, but to make it simpler let's consider DEALER).
Expression:
=count(
Aggr(
if(
sum({1<NameKPI={'CONS.'},Year={$(=Only(Year))}>} ValueKPI) / sum({1<NameKPI={'OBT. RITARATO'},Year={$(=Only(Year))}>} ValueKPI) * 100 > 110,
1,
Null()
),
Dealer
)
)
I need the total values by Year and NameKPI. Year dimension is "always one selected".
The chart works perfectly well if no month is selected.
Once I select a month one dealer disappears. I checked it and it turned out to have a record on just one month while all other dealers have records on all the months.
The question is how to make sure the chart show all the dealers regardless of the month selected!?
Best regards,
Valera
Accepted Solutions
- Mark as New
- Bookmark
- Subscribe
- Mute
- Subscribe to RSS Feed
- Permalink
- Report Inappropriate Content
Solved. COUNT({1}...) is a solution:
=count({1}
Aggr(
if(
sum({1<NameKPI={'CONS.'},Year={$(=Only(Year))},Month=>} ValueKPI)/sum({1<NameKPI={'OBT. RITARATO'},Year={$(=Only(Year))},Month=>} ValueKPI) * 100 > 110,
1,
Null()
),
Dealer
)
)
- Mark as New
- Bookmark
- Subscribe
- Mute
- Subscribe to RSS Feed
- Permalink
- Report Inappropriate Content
In the dealer dimension enable show all values. In presentation keep show missing, show nulls. This should ensure to show all dealers irrespective of the selection. But obviously in your case the dealer with only one month value will be shown 0 or -
Regards,
Kiran.
- Mark as New
- Bookmark
- Subscribe
- Mute
- Subscribe to RSS Feed
- Permalink
- Report Inappropriate Content
Thanks for the answer which actually solves some my other problems.
However, the Expression
=count(
Aggr(
if(
sum({1<NameKPI={'CONS.'},Year={$(=Only(Year))}>} ValueKPI) / sum({1<NameKPI={'OBT. RITARATO'},Year={$(=Only(Year))}>} ValueKPI) * 100 > 110,
1,
Null()
),
Dealer
)
)
still excludes one dealer if some month when the dealer did not operate is selected.
Check the attached screenshots.
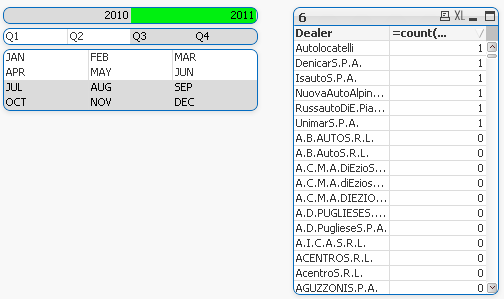
1) No month selected, all dealers are present. Those valid are with expression = 1.
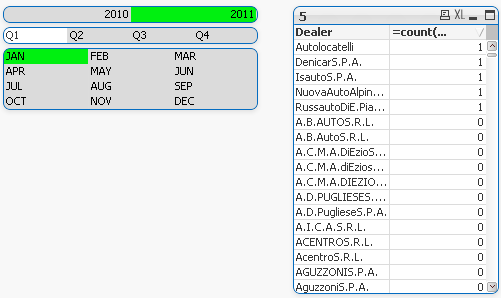
2) JAN selected. One dealer disappears. It actually gets evaluated as 0 and goes down the list.
3) JUN selected. The disappeared dealer appears again. It has records only on JUN.
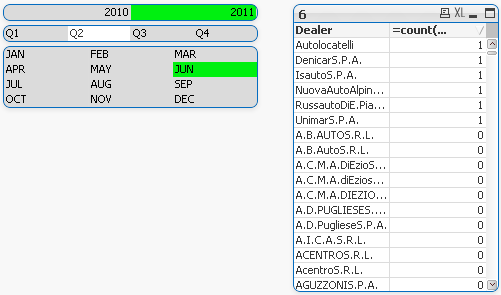
Since the expression is set to evaluate on the whole range of records regardless of the Month, I expected the results of these 3 screens to be the same.
Is it still possible to accomplish?
Thanks.
Regards,
Valera
- Mark as New
- Bookmark
- Subscribe
- Mute
- Subscribe to RSS Feed
- Permalink
- Report Inappropriate Content
Hi Valera,
Use the following expression
=count(
Aggr(
if(
sum({1<NameKPI={'CONS.'},Year={$(=Only(Year))},Month=>} ValueKPI) / sum({1<NameKPI={'OBT. RITARATO'},Year={$(=Only(Year))},Month=>} ValueKPI) * 100 > 110,
1,
Null()
),
Dealer
)
)
I just added Month= to set analysis which excludes selection on month.
Regards,
Kiran.
- Mark as New
- Bookmark
- Subscribe
- Mute
- Subscribe to RSS Feed
- Permalink
- Report Inappropriate Content
Solved. COUNT({1}...) is a solution:
=count({1}
Aggr(
if(
sum({1<NameKPI={'CONS.'},Year={$(=Only(Year))},Month=>} ValueKPI)/sum({1<NameKPI={'OBT. RITARATO'},Year={$(=Only(Year))},Month=>} ValueKPI) * 100 > 110,
1,
Null()
),
Dealer
)
)
- Mark as New
- Bookmark
- Subscribe
- Mute
- Subscribe to RSS Feed
- Permalink
- Report Inappropriate Content
Hi Valera,
Use the following expression
=count(
Aggr(
if(
sum({1<NameKPI={'CONS.'},Year={$(=Only(Year))},Month=>} ValueKPI) / sum({1<NameKPI={'OBT. RITARATO'},Year={$(=Only(Year))},Month=>} ValueKPI) * 100 > 110,
1,
Null()
),
Dealer
)
)
I just added Month= to set analysis which excludes selection on month.
Regards,
Kiran.
- Mark as New
- Bookmark
- Subscribe
- Mute
- Subscribe to RSS Feed
- Permalink
- Report Inappropriate Content
Just adding Month= did not help. It was necessary to override the scope of COUNT. 
Anyway, thanks for the support.