Unlock a world of possibilities! Login now and discover the exclusive benefits awaiting you.
- Qlik Community
- :
- All Forums
- :
- QlikView App Dev
- :
- Re: Values showing double after using IntervalMatc...
- Subscribe to RSS Feed
- Mark Topic as New
- Mark Topic as Read
- Float this Topic for Current User
- Bookmark
- Subscribe
- Mute
- Printer Friendly Page
- Mark as New
- Bookmark
- Subscribe
- Mute
- Subscribe to RSS Feed
- Permalink
- Report Inappropriate Content
Values showing double after using IntervalMatch table
Hi All,
I am trying to implenting the calendar view and Gantt chart using Pivot table.
To display the data in Gantt chart i have created IntervalMatch table that is displaying data in it as expected, but when i trying to display
in Straight table or Pivot table values showing very high Count.
i couldn't rectify it.
Can any one suggest the solution.
Please find attached QVW.
Thanks
Rajesh
- « Previous Replies
- Next Replies »
Accepted Solutions
- Mark as New
- Bookmark
- Subscribe
- Mute
- Subscribe to RSS Feed
- Permalink
- Report Inappropriate Content
May be try this
=If(aggr(count(DISTINCT If(Date = start_date, number)), Week, WeekDay)>2,
Aggr(count(DISTINCT If(Date = start_date, number)), Week, WeekDay) & If(GetFieldSelections(Source)='Change',' Change(s)', If(GetFieldSelections(Source)='Release',' Release(s)', ' Record(s)')),
'')
- Mark as New
- Bookmark
- Subscribe
- Mute
- Subscribe to RSS Feed
- Permalink
- Report Inappropriate Content
Which tab are we looking at? 'Sheet 1'? And also, which numbers are high? What do you expect them to be (can you share some example based on certain selections)?
- Mark as New
- Bookmark
- Subscribe
- Mute
- Subscribe to RSS Feed
- Permalink
- Report Inappropriate Content
It looks like that value occurs at all those levels. Its going to be tricky to handle this entirely in the front end. I expect you will need to change the script to handle this case better.
Share the screen shot of pivot table.
- Mark as New
- Bookmark
- Subscribe
- Mute
- Subscribe to RSS Feed
- Permalink
- Report Inappropriate Content
Hi Sunny thanks for your are responds
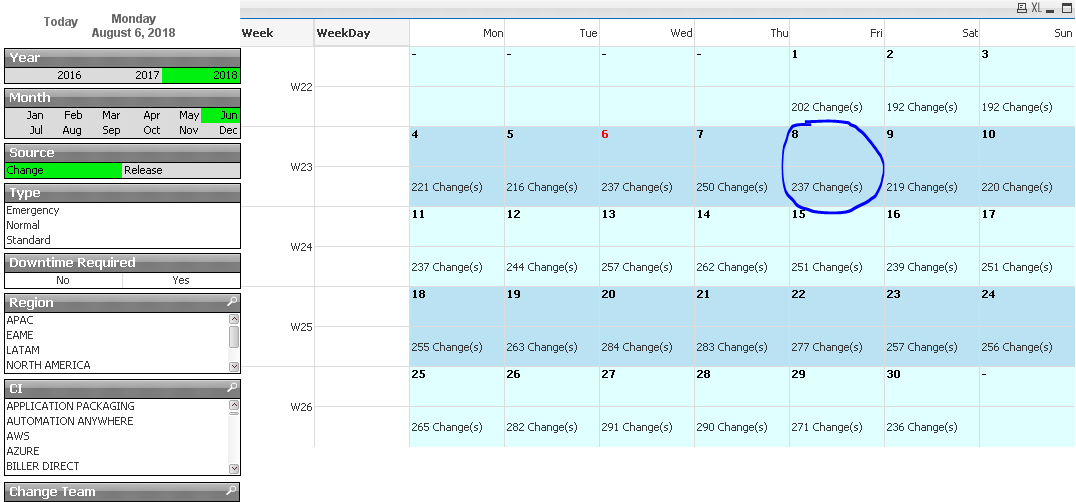
In the sheet 1 let say u have selected year 2018 , Month -June, day - 8 the Count should be 21 but it is showing
237 numbers which is wrong.
In sheet2 created Gantt Chart showing perfect Bars as startDate and EndDate data.
Thanks
Rajes
- Mark as New
- Bookmark
- Subscribe
- Mute
- Subscribe to RSS Feed
- Permalink
- Report Inappropriate Content
- Mark as New
- Bookmark
- Subscribe
- Mute
- Subscribe to RSS Feed
- Permalink
- Report Inappropriate Content
I might be missing something, but when I select June 8th 2018... I am seeing 237 different Numbers on Sheet2... how are you getting 21? Attaching Excel with all the Numbers I get
- Mark as New
- Bookmark
- Subscribe
- Mute
- Subscribe to RSS Feed
- Permalink
- Report Inappropriate Content
Are you looking for a particular Status or something which only results to 21?
- Mark as New
- Bookmark
- Subscribe
- Mute
- Subscribe to RSS Feed
- Permalink
- Report Inappropriate Content
intially i have created pivot table with out using Interval Match table.
Only Used Data, Master Calendar and DateBridge ( In script ) u can check , after that i got a new requirement from my Client that he wants to view in Gantt chart then i found and followed this thred (https://community.qlik.com/docs/DOC-6943#comment-68645) to accomplish this. but in Pivot chart the values are showing wrong.
i hope you got the issue now.
- Mark as New
- Bookmark
- Subscribe
- Mute
- Subscribe to RSS Feed
- Permalink
- Report Inappropriate Content
Can you share a sample where you have not used interval match and you are getting 21?
- Mark as New
- Bookmark
- Subscribe
- Mute
- Subscribe to RSS Feed
- Permalink
- Report Inappropriate Content
Not particular one total values showing in pivot chart are wrong
- « Previous Replies
- Next Replies »