Unlock a world of possibilities! Login now and discover the exclusive benefits awaiting you.
- Qlik Community
- :
- All Forums
- :
- QlikView App Dev
- :
- Wrap text of x axis dimension.
- Subscribe to RSS Feed
- Mark Topic as New
- Mark Topic as Read
- Float this Topic for Current User
- Bookmark
- Subscribe
- Mute
- Printer Friendly Page
- Mark as New
- Bookmark
- Subscribe
- Mute
- Subscribe to RSS Feed
- Permalink
- Report Inappropriate Content
Wrap text of x axis dimension.
Hi All,
I have a bar chart with one expression and one dimension. However the x axis labels for dimension values are too long and I want to wrap them in 2-3 lines. I tried various options in the Presentation, font and axes tabs but was unable to solve the problem. Is there some way I can solve this issue.
Thanks,
Neeraj
- Tags:
- new_to_qlikview
- Mark as New
- Bookmark
- Subscribe
- Mute
- Subscribe to RSS Feed
- Permalink
- Report Inappropriate Content
Wraping up the Dimension value is not possible. But what you could do is, go to chart property --> Style and change the orientation to horizontal. Only this much you can do, not more than that 
- Sridhar
- Mark as New
- Bookmark
- Subscribe
- Mute
- Subscribe to RSS Feed
- Permalink
- Report Inappropriate Content
Thanks for the prompt reponse Sridhar !!
Regards,
Neeraj
- Mark as New
- Bookmark
- Subscribe
- Mute
- Subscribe to RSS Feed
- Permalink
- Report Inappropriate Content
Hi:
Inserting chr(13) after a specified length or specific number of words would result the x-axis labels to 2 lines.
Hope this helps!!
Narasimha K
- Mark as New
- Bookmark
- Subscribe
- Mute
- Subscribe to RSS Feed
- Permalink
- Report Inappropriate Content
Using a horizontal orientation is a good option. Or else if you need the same vertical plot, you can also try the following
Axes tab -> Change Primary dimension Labels to Vertical ( | ) or Inclined ( / )
Presentation Tab -> limiting the number of visible bars (Max Visible Number) and using X axis scroll bar
Not sure if you Dimension values are still bigger ..
Regards
DS
- Mark as New
- Bookmark
- Subscribe
- Mute
- Subscribe to RSS Feed
- Permalink
- Report Inappropriate Content
Qlikview: Wrapping text in X Axis
http://scribbledbygb.blogspot.co.uk/2014/10/wrap-text-in-x-axis-qlikview.html
- Mark as New
- Bookmark
- Subscribe
- Mute
- Subscribe to RSS Feed
- Permalink
- Report Inappropriate Content
Hi Narasimha,
Where to write that chr(13) ?
Could u pls give a clear explanation ?
Thank you
- Mark as New
- Bookmark
- Subscribe
- Mute
- Subscribe to RSS Feed
- Permalink
- Report Inappropriate Content
Hi,
What you can do is,if the dimension u are using is containing less number of values and if they are very long as you said above.
Then,you can use calculated dimensions and rename them or shorten them as you want..
let me know If anything needed..
- Mark as New
- Bookmark
- Subscribe
- Mute
- Subscribe to RSS Feed
- Permalink
- Report Inappropriate Content
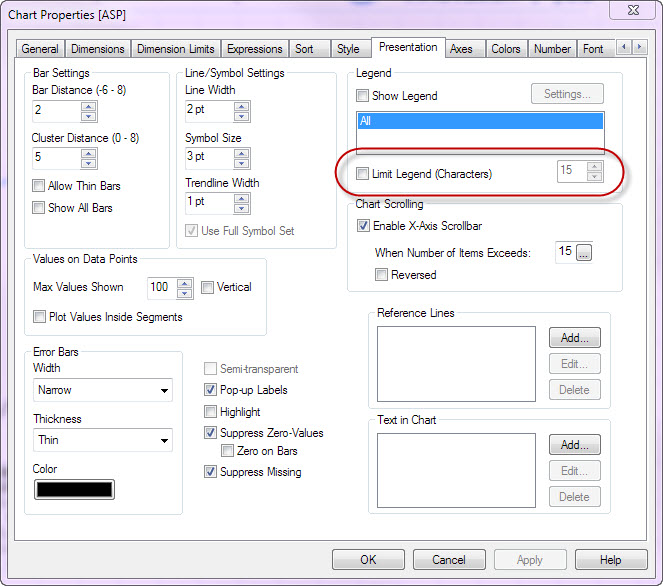
In the Presentation tab, unselect the Limit Legend (Characters) check box. This may help to display a few extra characters, but as mentioned by others - it is not possible to wrap text in legends
- Mark as New
- Bookmark
- Subscribe
- Mute
- Subscribe to RSS Feed
- Permalink
- Report Inappropriate Content
Personally, I think this is a shortcoming of the application. I'm always being asked to "display the full labels"... which is a chore. It irks me to consider saying "no" to something as basic as that.
However, I've used something like the following as the expression of a dimension:
=if(Len([FieldName])>30,Left([FieldName],30) & '-' & Chr(10) & Right([FieldName],Len([FieldName])-30),[FieldName])
Essentially, this will look for field names > 30 characters.
If it's > 30, it splits the line @ the 30th character (using the Chr(10)) , adds a hyphen, and displays the remainder of the text on the line below. If it's < 30, it displays the whole field name.
Obviously you can change the number of characters from 30 to fit your own chart's size.
It's crude, but it works well enough in most instances.
If you come up with any better ideas, please let me know!
(I suspect there could be a way of counting the characters in a string, and counting the number of spaces in a string, then performing the split at one of those spaces so that you don't get single/orphan characters on the second line...but if the application just had a few more fundamental and improved display options, we wouldn't have to even consider it!)