Unlock a world of possibilities! Login now and discover the exclusive benefits awaiting you.
- Qlik Community
- :
- All Forums
- :
- QlikView App Dev
- :
- Average in line chart
- Subscribe to RSS Feed
- Mark Topic as New
- Mark Topic as Read
- Float this Topic for Current User
- Bookmark
- Subscribe
- Mute
- Printer Friendly Page
- Mark as New
- Bookmark
- Subscribe
- Mute
- Subscribe to RSS Feed
- Permalink
- Report Inappropriate Content
Average in line chart
I have the following simplified dataset:
LOAD * INLINE [
Week, Salesrep, #Visit
1, Hank, 2
1, Hank, 1
1, John, 3
2, Pete, 3
2, Hank, 1
3, John, 2
3, Hank, 4
3, Pete, 12
4, Pete, 1
4, John, 1
4, Hank, 7
];
This indicates per week how many visits a salesrep has done.
I have created a line chart with an average number of visits per week. In the options of the expression you can select the average trendline to be displayed. I would like to give this line a different look.
That is the reason I have created a second expression that calculates the average. Unfortunately I cannot get my calculated line to match the trend line.
See the image below for an impression:
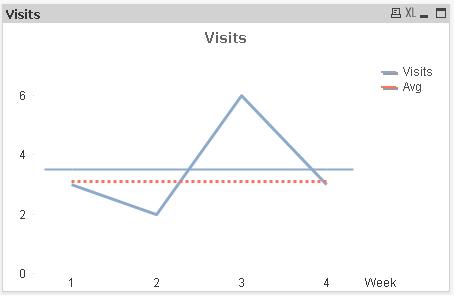
You can see the Visits line in blue and the corresponding trendline. In red the Avg line is just below that.
The table below displays the numbers that correspond to the chart.
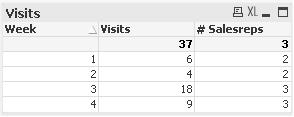
The Visits trendline corresponds to ((6 / 2) + (4 / 2) + (18 / 3) + (9 / 3)) / 4 = 3.5
The Avg trendline corresponds to 37 / 3 / 4 = 3.083
See attached qvw file for the formula's I used. I would like to have a formula for the Avg expression that enables me to get the same result as the trendline. I must be missing something really easy here, but I just can't get it to work...
Accepted Solutions
- Mark as New
- Bookmark
- Subscribe
- Mute
- Subscribe to RSS Feed
- Permalink
- Report Inappropriate Content
Hi,
try this expression:
avg(total aggr( SUM([#Visit]) / COUNT(DISTINCT Salesrep),Week))
C u,
Stefano.
- Mark as New
- Bookmark
- Subscribe
- Mute
- Subscribe to RSS Feed
- Permalink
- Report Inappropriate Content
Hi,
try this expression:
avg(total aggr( SUM([#Visit]) / COUNT(DISTINCT Salesrep),Week))
C u,
Stefano.
- Mark as New
- Bookmark
- Subscribe
- Mute
- Subscribe to RSS Feed
- Permalink
- Report Inappropriate Content
Thank you Stefano! That is exactly what I meant.