Unlock a world of possibilities! Login now and discover the exclusive benefits awaiting you.
- Qlik Community
- :
- All Forums
- :
- QlikView App Dev
- :
- Re: using month-year as dimension need to show pre...
- Subscribe to RSS Feed
- Mark Topic as New
- Mark Topic as Read
- Float this Topic for Current User
- Bookmark
- Subscribe
- Mute
- Printer Friendly Page
- Mark as New
- Bookmark
- Subscribe
- Mute
- Subscribe to RSS Feed
- Permalink
- Report Inappropriate Content
using month-year as dimension need to show previous 3 months data excluding current month
hello,
I have requirement to show previous 3 months data excluding current month in table chart month-year as dimension.
i am using below set expression
=Sum({1<DATE={">=$(=MonthStart(AddMonths(Max(DATE),-3)))<=$(=MonthEnd(AddMonths(Max(DATE),-1)))"}>}[SUBS_GROSS_ADD])
it is working for text object respective of selection.but in table chart i have four aggregation fields based on moth-year dimension and only for one aggregation i have to show previous 3 months excluding current month so i am using above set expression for that but it is not working.it is giving month wise aggregation instead of previous 3 months results.how can i achieve this in table chart with dimension.
please help on same.
Thanks in advance.
Accepted Solutions
- Mark as New
- Bookmark
- Subscribe
- Mute
- Subscribe to RSS Feed
- Permalink
- Report Inappropriate Content
can you share a sample app?
is the time one of the dimensions in your table chart?
- Mark as New
- Bookmark
- Subscribe
- Mute
- Subscribe to RSS Feed
- Permalink
- Report Inappropriate Content
can you share a sample app?
is the time one of the dimensions in your table chart?
- Mark as New
- Bookmark
- Subscribe
- Mute
- Subscribe to RSS Feed
- Permalink
- Report Inappropriate Content
yes,Month_Year is dimension for table chart
can't share sample app that is huge file i can attach screenshot for your information
please help on same
what ever marked for that iam applying set expression as mentioned above discussion.
Thanks in advance
regards
kavitha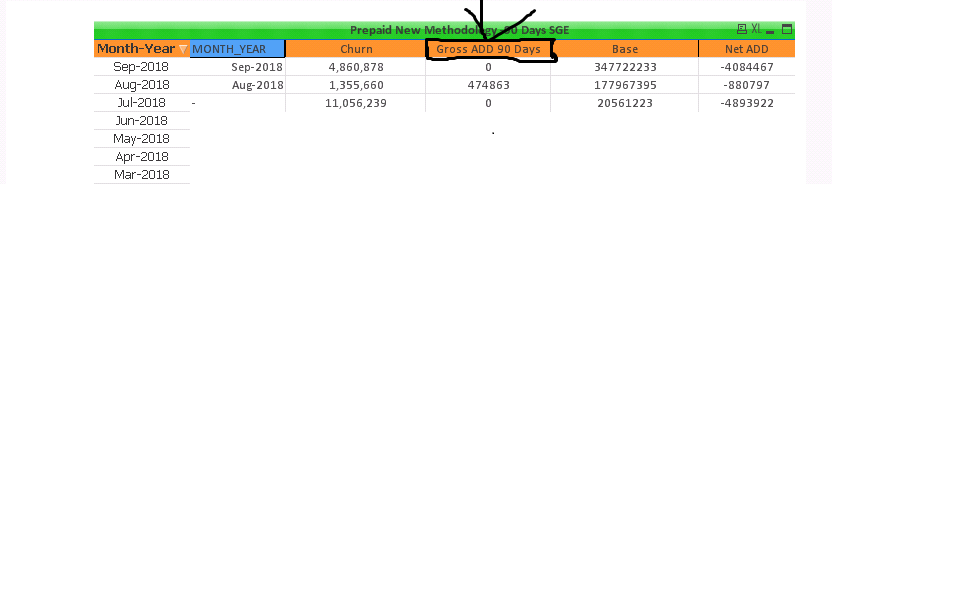
- Mark as New
- Bookmark
- Subscribe
- Mute
- Subscribe to RSS Feed
- Permalink
- Report Inappropriate Content
since month year is a dimension set analysis wont work i think.
you can possibly use above function or an as of table (see below link)
Calculating rolling n-period totals, averages or other aggregations
- Mark as New
- Bookmark
- Subscribe
- Mute
- Subscribe to RSS Feed
- Permalink
- Report Inappropriate Content
It seems like you're trying to create a table chart in your data analysis tool, and you want to display the sum of a specific measure (SUBS_GROSS_ADD) for the previous three months excluding the current month. Your set expression looks correct, but it might not be working as expected in the table chart due to how dimensions and expressions interact in your tool.
Here are a few suggestions to troubleshoot and possibly resolve the issue:
1. Check Dimension Configuration: Ensure that your table chart is configured correctly to display the month-year dimension. It's possible that the dimension setup or sorting is affecting the results. Make sure the dimension is set to display month-year in the desired format (e.g., "MMM-YYYY" or "MM/YYYY").
2. Verify Set Analysis Syntax: Double-check the syntax of your set expression to ensure it's correctly filtering the data for the previous three months excluding the current month. Sometimes small syntax errors can lead to unexpected results.
3. Test Set Expression in a Text Object: As you mentioned, the set expression works fine in a text object, so you might want to test it further to ensure it's behaving as expected. Try creating a text object with the set expression and verify that it shows the correct sum for the previous three months excluding the current month.
4. Consider Chart Settings: Review the settings of your table chart to ensure there are no additional filters or configurations that might be affecting the display of data. Check if there are any filters applied at the chart level that could override the set expression.
5. Debugging Tools: Some data analysis tools offer debugging tools or features that allow you to inspect the data at different stages of processing. Utilize these tools to debug and understand how the set expression is affecting the data displayed in the table chart.
If you're still facing issues after trying these suggestions, it might be helpful to consult the documentation or community forums for your specific data analysis tool for more tailored assistance. Additionally, providing more details about the tool you're using and the structure of your data could help in providing a more precise solution.
- Mark as New
- Bookmark
- Subscribe
- Mute
- Subscribe to RSS Feed
- Permalink
- Report Inappropriate Content
It seems like you're working with set analysis in QlikView or Qlik Sense to display the previous 3 months' data excluding the current month in a table chart. Let's refine your expression to achieve this.
You can modify your expression to use a calculated dimension instead of directly applying the set analysis to the expression. Here's how you can do it:
1. Create a calculated dimension that calculates the Month-Year for each date and then filters out the current month and the previous 3 months.
2. Apply your expression to this calculated dimension.
Here's how you can modify your expression and create the calculated dimension:
1. Create a calculated dimension:
```qlikview
=If(
MonthStart(DATE) >= MonthStart(AddMonths(Today(), -4))
AND
MonthStart(DATE) < MonthStart(Today()),
MonthYear(DATE)
)
```
This calculated dimension will only include Month-Year values for dates falling in the previous 3 months excluding the current month. Adjust the date field name (`DATE`) and formatting function (`MonthYear()`) according to your actual field names and formatting preferences.
2. Apply your expression to this calculated dimension in your table chart.
```qlikview
=Sum({<DATE={">=$(=MonthStart(AddMonths(Max(DATE),-3)))<=$(=MonthEnd(AddMonths(Max(DATE),-1)))"}>}[SUBS_GROSS_ADD])
```