Unlock a world of possibilities! Login now and discover the exclusive benefits awaiting you.
- Qlik Community
- :
- All Forums
- :
- QlikView App Dev
- :
- show just month in chart axes
Options
- Subscribe to RSS Feed
- Mark Topic as New
- Mark Topic as Read
- Float this Topic for Current User
- Bookmark
- Subscribe
- Mute
- Printer Friendly Page
Turn on suggestions
Auto-suggest helps you quickly narrow down your search results by suggesting possible matches as you type.
Showing results for
Contributor III
2018-09-23
07:49 AM
- Mark as New
- Bookmark
- Subscribe
- Mute
- Subscribe to RSS Feed
- Permalink
- Report Inappropriate Content
show just month in chart axes
Dears
I have below chart in QV:
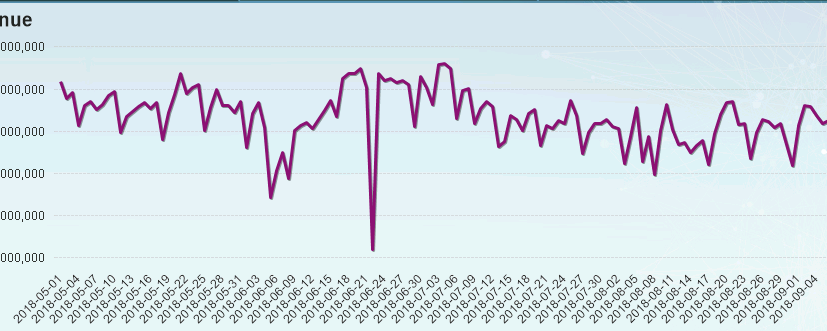
I want show just month name in my chart and when user click on month name in chart, it show 30 days of mentioned month.
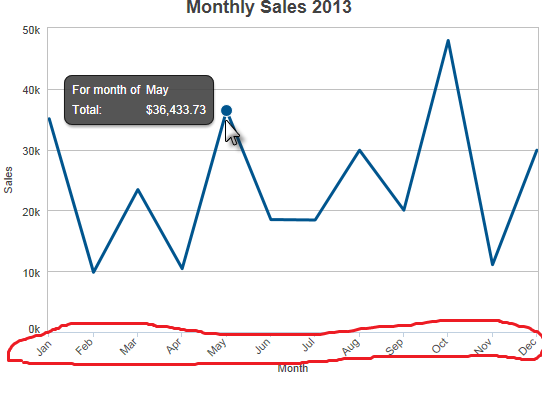
like below chart :
would you please help me?
dimension : DATE_KEY
Expression: sum({<Area_Category-={"Test","Free ShortCode","Xtratime","ACS"}>}REVENUE)
319 Views
1 Solution
Accepted Solutions
MVP
2018-09-23
08:39 AM
- Mark as New
- Bookmark
- Subscribe
- Mute
- Subscribe to RSS Feed
- Permalink
- Report Inappropriate Content
Use a drill down dimension group (you can edit the groups on dimension tab of your chart or in document properties) with dimensions Month and Date.
245 Views
2 Replies
MVP
2018-09-23
08:39 AM
- Mark as New
- Bookmark
- Subscribe
- Mute
- Subscribe to RSS Feed
- Permalink
- Report Inappropriate Content
Use a drill down dimension group (you can edit the groups on dimension tab of your chart or in document properties) with dimensions Month and Date.
246 Views
Contributor III
2018-09-24
03:33 AM
Author
- Mark as New
- Bookmark
- Subscribe
- Mute
- Subscribe to RSS Feed
- Permalink
- Report Inappropriate Content
Thank youuuuuuuuuuuuuuuuuuuuuuu 
245 Views