Unlock a world of possibilities! Login now and discover the exclusive benefits awaiting you.
- Qlik Community
- :
- Forums
- :
- Analytics
- :
- New to Qlik Analytics
- :
- Percentage Bar Chart does not work when using =mon...
- Subscribe to RSS Feed
- Mark Topic as New
- Mark Topic as Read
- Float this Topic for Current User
- Bookmark
- Subscribe
- Mute
- Printer Friendly Page
- Mark as New
- Bookmark
- Subscribe
- Mute
- Subscribe to RSS Feed
- Permalink
- Report Inappropriate Content
Percentage Bar Chart does not work when using =monthname
Hi everyone,
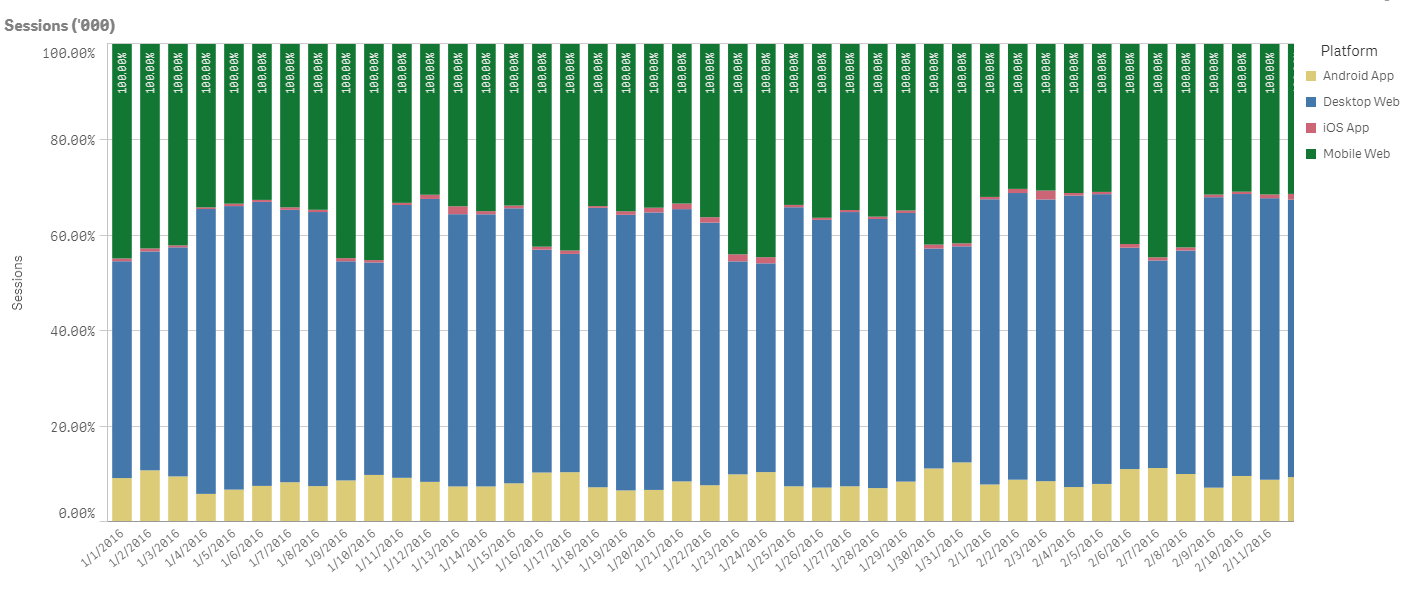
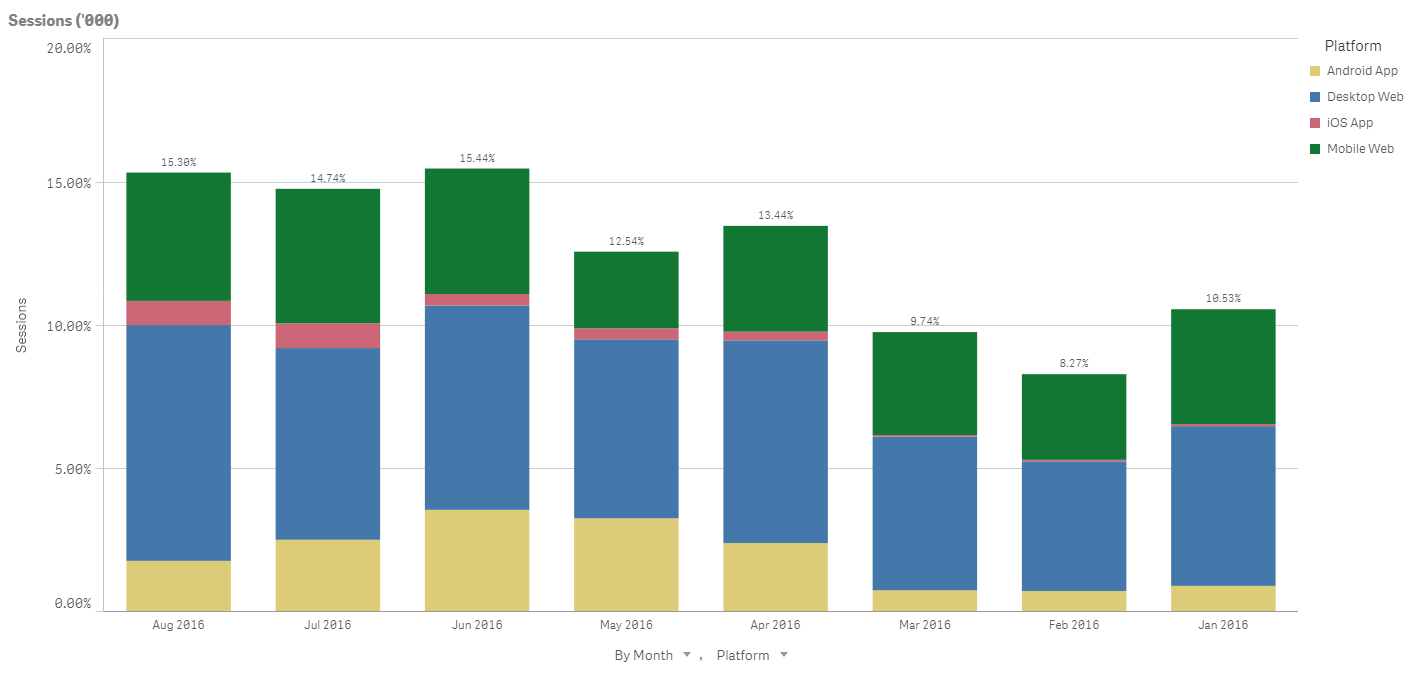
I am making a stacked bar chart and trying to show percentages.
the function is as follows:
Sum(sessions1)/Sum(TOTAL <browse_date> sessions1).
When using the date dimension everything is fine, because each day is measured as 100% (image 1.1), however once i change to =monthname(date) the chart changes into 100% for the total data (image 1.2).
Can someone point out what i might have done wrong?
- Mark as New
- Bookmark
- Subscribe
- Mute
- Subscribe to RSS Feed
- Permalink
- Report Inappropriate Content
It's because browse_date is no longer your dimension.
I would solve this by creating a month field in the script using monthname(browse_date) as browse_month, then update your chart to use the browse_month field as dimension and Sum(sessions1)/Sum(TOTAL <browse_month> sessions1) as expression.
- Mark as New
- Bookmark
- Subscribe
- Mute
- Subscribe to RSS Feed
- Permalink
- Report Inappropriate Content
I have developed similar type of charts already
You can develop a calculated field to get the month at the script level:
Date(MonthStart(browse_date),'MM-YYY') as browse_month
& you may use this dimension as following at expression level:
Sum(sessions1)/Sum(TOTAL <browse_month> sessions1)
and ofcourse, please select the dimension as browse_month
Hope this helps.