Unlock a world of possibilities! Login now and discover the exclusive benefits awaiting you.
- Qlik Community
- :
- All Forums
- :
- QlikView App Dev
- :
- Qlikview Linechart
- Subscribe to RSS Feed
- Mark Topic as New
- Mark Topic as Read
- Float this Topic for Current User
- Bookmark
- Subscribe
- Mute
- Printer Friendly Page
- Mark as New
- Bookmark
- Subscribe
- Mute
- Subscribe to RSS Feed
- Permalink
- Report Inappropriate Content
Qlikview Linechart
Hi All,
Is there any way I can get the line chart based on below data,
| YearMonth | Date | Value |
| 201507 | 20150703 | 0.4 |
| 201507 | 20150710 | 0.6 |
| 201507 | 20150717 | 0.9 |
| 201508 | 20150807 | 1.2 |
| 201508 | 20150814 | 1.4 |
| 201509 | 20150907 | 1.5 |
| 201509 | 20150911 | 1.6 |
| 201510 | 20151002 | 1.7 |
| 201511 | 20151106 | 1.2 |
| 201511 | 20151113 | 0.7 |
| 201511 | 20151120 | 1.4 |
| 201512 | 20151204 | 1.8 |
| 201512 | 20151231 | 2 |
| 201601 | 20160108 | 2.5 |
| 201602 | 20160205 | 1.5 |
| 201602 | 20160212 | 0.9 |
| 201602 | 20160219 | 1.3 |
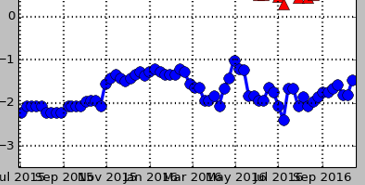
now, my requirement is on my x axis there will be only YearMonth but, values should get plotted based on date wise value. Which means for YearMonth 201507 there should be three data points.
Please see attached image as reference.
Regards,
Vijeta
Message was edited by: vijeta sharma
- Mark as New
- Bookmark
- Subscribe
- Mute
- Subscribe to RSS Feed
- Permalink
- Report Inappropriate Content
Why three points needed? If so, I can say Add these two dimensions and disable the Legend
- Mark as New
- Bookmark
- Subscribe
- Mute
- Subscribe to RSS Feed
- Permalink
- Report Inappropriate Content
H !i Vijeta,
This is how you can do.Please see screenshot and attached qvw.
 H
H
Regards,
Mayank Raoka !
- Mark as New
- Bookmark
- Subscribe
- Mute
- Subscribe to RSS Feed
- Permalink
- Report Inappropriate Content
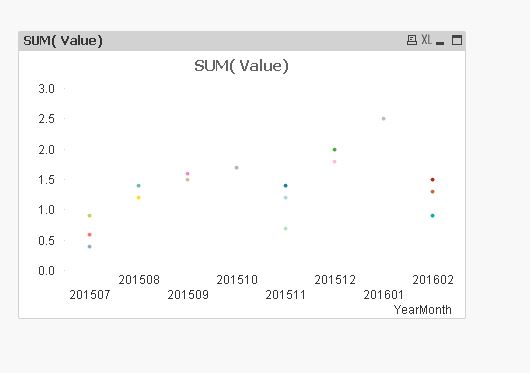
This I have already tried but, it's not showing lines connecting the data points
- Mark as New
- Bookmark
- Subscribe
- Mute
- Subscribe to RSS Feed
- Permalink
- Report Inappropriate Content
because for 201507 we have 3 dates values.Though I disable the legends my x axis will show dates only but, i need yearmonth.
- Mark as New
- Bookmark
- Subscribe
- Mute
- Subscribe to RSS Feed
- Permalink
- Report Inappropriate Content
Take First Dimension as YearMonth and Second dimension as Date
- Mark as New
- Bookmark
- Subscribe
- Mute
- Subscribe to RSS Feed
- Permalink
- Report Inappropriate Content
That I have tried but, it's showing chart as mayankraoka shown it's not creating line which will connect my data points
- Mark as New
- Bookmark
- Subscribe
- Mute
- Subscribe to RSS Feed
- Permalink
- Report Inappropriate Content
Hi Vijeta,
this is what you want.Try the workaround i have provided in attached qvw.
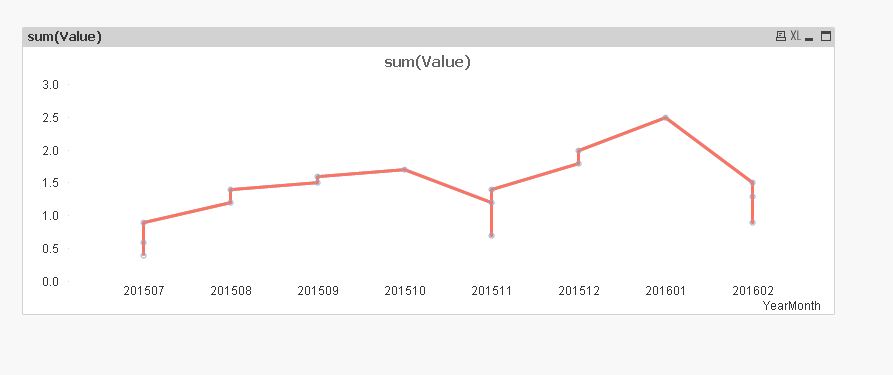
Regards,
Mayank
- Mark as New
- Bookmark
- Subscribe
- Mute
- Subscribe to RSS Feed
- Permalink
- Report Inappropriate Content
In your application i can't see x axis labels. Even I have copied same chart into my application but on X-axis its showing all dates