Unlock a world of possibilities! Login now and discover the exclusive benefits awaiting you.
- Qlik Community
- :
- All Forums
- :
- QlikView App Dev
- :
- How to Create chart with Rolling values
- Subscribe to RSS Feed
- Mark Topic as New
- Mark Topic as Read
- Float this Topic for Current User
- Bookmark
- Subscribe
- Mute
- Printer Friendly Page
- Mark as New
- Bookmark
- Subscribe
- Mute
- Subscribe to RSS Feed
- Permalink
- Report Inappropriate Content
How to Create chart with Rolling values
Hi,
I need to plot a bar chart but the data is cumulative (i.e. the data is from Jan 2007 to Current month) if i want current month values then i must subtract the current month value with the previous month value (i.e. if i want value for month of Sep 2011 then i must subtract the Sep 2011 value with the Aug 2011 Value) Similarly i have to find all the previous 12 months value and add it to get the Sep 2011 values, for your reference i have attached the Excel in that i have to create chart for Rolling value
Its Urgent can any one Help
- « Previous Replies
-
- 1
- 2
- Next Replies »
Accepted Solutions
- Mark as New
- Bookmark
- Subscribe
- Mute
- Subscribe to RSS Feed
- Permalink
- Report Inappropriate Content
Hi Mohammed,
If you need to exclude Jan month from subtraction then you can use the below code.
if(Previous(Value)>0,if(Month(num#(Month))=1,Value,Value-Previous(Value)),Value) as Values resident Temp;
Hope this is what you wanted.
Regards,
Sajeevan
- Mark as New
- Bookmark
- Subscribe
- Mute
- Subscribe to RSS Feed
- Permalink
- Report Inappropriate Content
Hi,
I'm not sure my solution is the one that you looking for or not. So let check my attached file.
Regards,
Sokkorn
- Mark as New
- Bookmark
- Subscribe
- Mute
- Subscribe to RSS Feed
- Permalink
- Report Inappropriate Content
Hi,
Thanks for your reply, but i am using PE version of QlikView, it would be great if you can write it in note pad or reply me
- Mark as New
- Bookmark
- Subscribe
- Mute
- Subscribe to RSS Feed
- Permalink
- Report Inappropriate Content
Hi
Let try it:
1. Download my attached file and put it in the same directory with your QVW
2. Use this scrip
CrossTable([Jan-08], Data)
LOAD F1 AS [Header],
[Jan-08],
[Feb-08],
[Mar-08],
[Apr-08],
[May-08],
[Jun-08],
[Jul-08],
[Aug-08],
[Sep-08],
[Oct-08],
[Nov-08],
[Dec-08],
[Jan-09],
[Feb-09],
[Mar-09],
[Apr-09],
[May-09],
[Jun-09],
[Jul-09],
[Aug-09],
[Sep-09],
[Oct-09],
[Nov-09],
[Dec-09],
[Jan-10],
[Feb-10],
[Mar-10],
[Apr-10],
[May10],
[Jun-10],
[Jul-10],
[Aug-10],
[Sep-10],
[Oct-10],
[Nov-10],
[Dec-10],
[Jan-11],
[Feb-11],
[Mar-11],
[Apr-11],
[May-11],
[Jun-11],
[Jul-11],
[Aug-11],
[Sep-11]
FROM
[Book1.xlsx]
(ooxml, embedded labels, header is 1 lines, table is Sheet1);
3. Create Bar Chart with [Jan-08] and [Header] as Dimension then use SUM(Data) as Expresion
Hope this help you.
Regards,
Sokkorn
- Mark as New
- Bookmark
- Subscribe
- Mute
- Subscribe to RSS Feed
- Permalink
- Report Inappropriate Content
i think you not got wht exactly i want,
the each month Value is calculated by using formulas, i want to do it in the chart itself, See i have uploaded the cumulative data, i have to creat the chart with Rolling values wch is mut be calculated,
- Mark as New
- Bookmark
- Subscribe
- Mute
- Subscribe to RSS Feed
- Permalink
- Report Inappropriate Content
I think that there are at least two ways to accomplish this task the first is by setting a range that you want to calculate across:
RangeAvg(Above(Sum( {$<Week=, Year=, Quarter=, Month= {'>$(=WeekStart(Max(Date),-24,0))<=$(=WeekStart(Max(Date),0,0))'}>} Sales),0,12))
The above example should provide a rolling calcualtion. This example is calculating the SUM of Sales dollars in a continuously rolling 24 month range for the past 12 months.
The other way to accomplish this is to use the ACCUMULATE function on the expression tab. For the expression that you would like to provide a rolling calculation use the below formula and make sure that the number of steps you are accumulating for is = to the number of months, weeks or years that you wan tto SUM together for the rolling total.
Above(Sum(Sales)) / 12
hopefully this helps,
Ed
- Mark as New
- Bookmark
- Subscribe
- Mute
- Subscribe to RSS Feed
- Permalink
- Report Inappropriate Content
Hi Ed,
Thanks alot for your reply, from your formula has given me some ideal, but i can't able to get desire values, there are to condition in my value, firstly i have to Subtract current month value with the previous month similarly have to do it for all previous 11 months then i have to sum it all to get the Actual Current Month Value,
And can u give a Brief on the fIrst formula which you have mention, how does it work
- Mark as New
- Bookmark
- Subscribe
- Mute
- Subscribe to RSS Feed
- Permalink
- Report Inappropriate Content
i am still not able to get the chart,
- Mark as New
- Bookmark
- Subscribe
- Mute
- Subscribe to RSS Feed
- Permalink
- Report Inappropriate Content
Hi Mohammed,
You need to create some more additional date fields to achieve the results. Find below the script you need to work with
// Load the data as it is from the Excel file - I am loading only the months and the Cumulated value in to temp table
Temp:
CrossTable(Month, Value)
LOAD * FROM
C:\Book1.xlsx
(ooxml, embedded labels, table is Sheet1, filters(
Remove(Row, Pos(Top, 3)),
Remove(Row, Pos(Top, 3))
));
Data:
Load F1,
MakeDate(Year(num#(Month)),month(num#(Month)),Day(num#(Month))) as Month,
Year(num#(Month)) as Year,
Value as CValue,
if(Previous(Value)>0,Value-Previous(Value),Value) as Values resident Temp;
drop table Temp;
// Create the rolling periods which needs to be used for the graph
RollingMonths:
load Month, Month as RollingMonth, year(Month) as RollingYear resident Data;
load Month, Addmonths(Month,1,1) as RollingMonth, year(Addmonths(Month,1,1)) as RollingYear resident Data;
load Month, Addmonths(Month,2,1) as RollingMonth, year(Addmonths(Month,2,1)) as RollingYear resident Data;
load Month, Addmonths(Month,3,1) as RollingMonth, year(Addmonths(Month,3,1)) as RollingYear resident Data;
load Month, Addmonths(Month,4,1) as RollingMonth, year(Addmonths(Month,4,1)) as RollingYear resident Data;
load Month, Addmonths(Month,5,1) as RollingMonth, year(Addmonths(Month,5,1)) as RollingYear resident Data;
load Month, Addmonths(Month,6,1) as RollingMonth, year(Addmonths(Month,6,1)) as RollingYear resident Data;
load Month, Addmonths(Month,7,1) as RollingMonth, year(Addmonths(Month,7,1)) as RollingYear resident Data;
load Month, Addmonths(Month,8,1) as RollingMonth, year(Addmonths(Month,8,1)) as RollingYear resident Data;
load Month, Addmonths(Month,9,1) as RollingMonth, year(Addmonths(Month,9,1)) as RollingYear resident Data;
load Month, Addmonths(Month,10,1) as RollingMonth, year(Addmonths(Month,10,1)) as RollingYear resident Data;
load Month, Addmonths(Month,11,1) as RollingMonth, year(Addmonths(Month,11,1)) as RollingYear resident Data;
Hope this is what you were looking for.
The graph will look like below
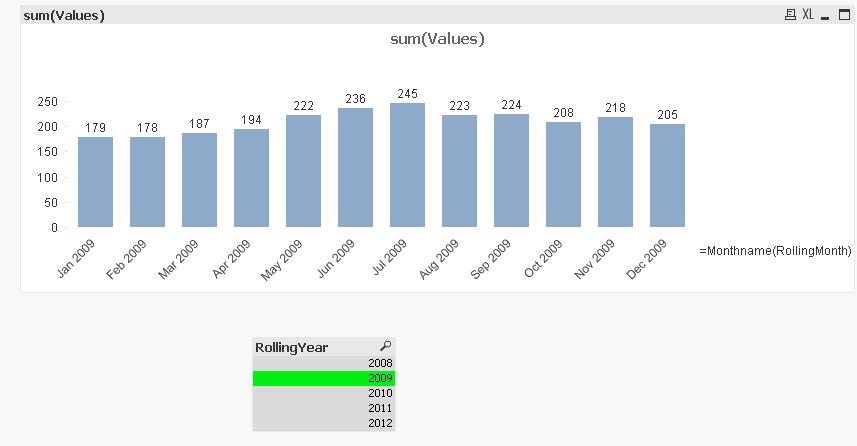
Best Regards,
Sajeevan
- Mark as New
- Bookmark
- Subscribe
- Mute
- Subscribe to RSS Feed
- Permalink
- Report Inappropriate Content
hi Sanjeev,
thanks for your reply, but am not able to get the exact chart, and me not able to understnd it, if possible can u give some more bried abt it
- « Previous Replies
-
- 1
- 2
- Next Replies »