Unlock a world of possibilities! Login now and discover the exclusive benefits awaiting you.
- Qlik Community
- :
- All Forums
- :
- QlikView App Dev
- :
- How to format the bar chart like this.
- Subscribe to RSS Feed
- Mark Topic as New
- Mark Topic as Read
- Float this Topic for Current User
- Bookmark
- Subscribe
- Mute
- Printer Friendly Page
- Mark as New
- Bookmark
- Subscribe
- Mute
- Subscribe to RSS Feed
- Permalink
- Report Inappropriate Content
How to format the bar chart like this.
Hi dear friends,
I'm new to Qlikview,when I try to do a bar chart I got some problems,please help me,thank you very much.
I have two fileds: Gender,Product as the dimension
one Expression: COUNT(DISTINCT IF(Type = 'Claims',ClaimsPolicyID,0))/COUNT(DISTINCT [Policy Number])
I try to do the chart like this,
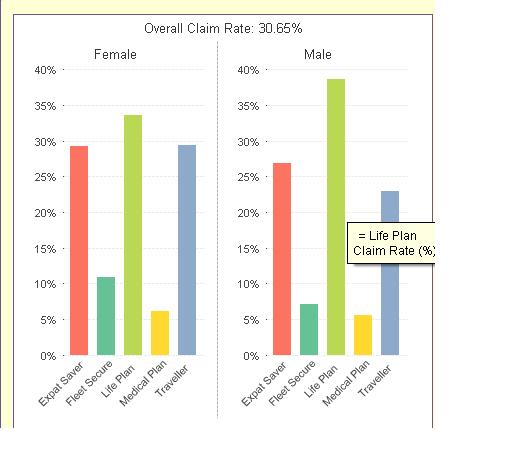
but I attempt a lot of methoms,it cann't meet my requirment,
It display like this;
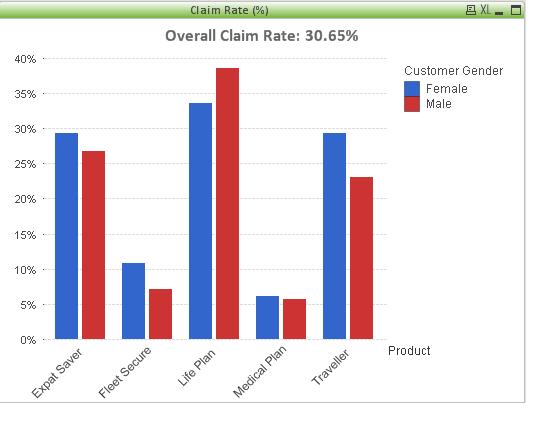
so I wonder if there are some properites to change the format like the second picture.
Thanks a lot,
kechin
- Tags:
- new_to_qlikview
Accepted Solutions
- Mark as New
- Bookmark
- Subscribe
- Mute
- Subscribe to RSS Feed
- Permalink
- Report Inappropriate Content
Hi kechin,
try a trellis chart (there is an optional dialog available on dimensions tab of your chart properties).
Hope this helps,
Stefan
- Mark as New
- Bookmark
- Subscribe
- Mute
- Subscribe to RSS Feed
- Permalink
- Report Inappropriate Content
Hi kechin,
try a trellis chart (there is an optional dialog available on dimensions tab of your chart properties).
Hope this helps,
Stefan
- Mark as New
- Bookmark
- Subscribe
- Mute
- Subscribe to RSS Feed
- Permalink
- Report Inappropriate Content
Hi swuehl,
thanks for you reply,my version is Personal Eidtor 10,all the chart type is below,
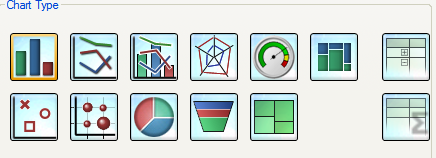
and I cann't find the 'trellis chart',so would you please show me which one is the expected one,
this chart is a sample I got from the Qlikview Samples, and the properties display as Bar chart,
if you have any idea about this
thanks
kechin.
- Mark as New
- Bookmark
- Subscribe
- Mute
- Subscribe to RSS Feed
- Permalink
- Report Inappropriate Content
Hi swuehl,
I got it,thanks a lot.