Unlock a world of possibilities! Login now and discover the exclusive benefits awaiting you.
- Qlik Community
- :
- All Forums
- :
- QlikView App Dev
- :
- Bar chart in a table cell?
- Subscribe to RSS Feed
- Mark Topic as New
- Mark Topic as Read
- Float this Topic for Current User
- Bookmark
- Subscribe
- Mute
- Printer Friendly Page
- Mark as New
- Bookmark
- Subscribe
- Mute
- Subscribe to RSS Feed
- Permalink
- Report Inappropriate Content
Bar chart in a table cell?
Hi,
At the moment, I have a table cell which displays a percentage.
I'd like to show this as a small bar chart, in the cell.
Is this possible?
Thanks,
R
- Mark as New
- Bookmark
- Subscribe
- Mute
- Subscribe to RSS Feed
- Permalink
- Report Inappropriate Content
yes it's possible. 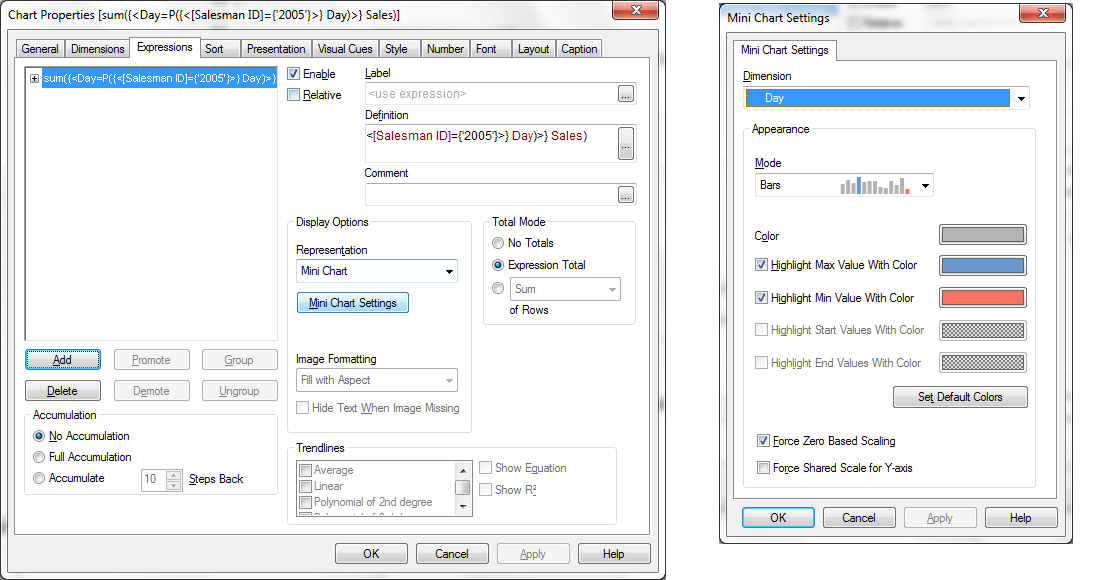
Go to the expression tab and click on mini chart settings. Now select the dimension you want and then the mode.
Regards,
iSam
- Mark as New
- Bookmark
- Subscribe
- Mute
- Subscribe to RSS Feed
- Permalink
- Report Inappropriate Content
Thanks, although I just want a single bar - it's only one % value.
Would that still work?
- Mark as New
- Bookmark
- Subscribe
- Mute
- Subscribe to RSS Feed
- Permalink
- Report Inappropriate Content
I think it would work. However it goes above my knowledge L
- Mark as New
- Bookmark
- Subscribe
- Mute
- Subscribe to RSS Feed
- Permalink
- Report Inappropriate Content
Hi,
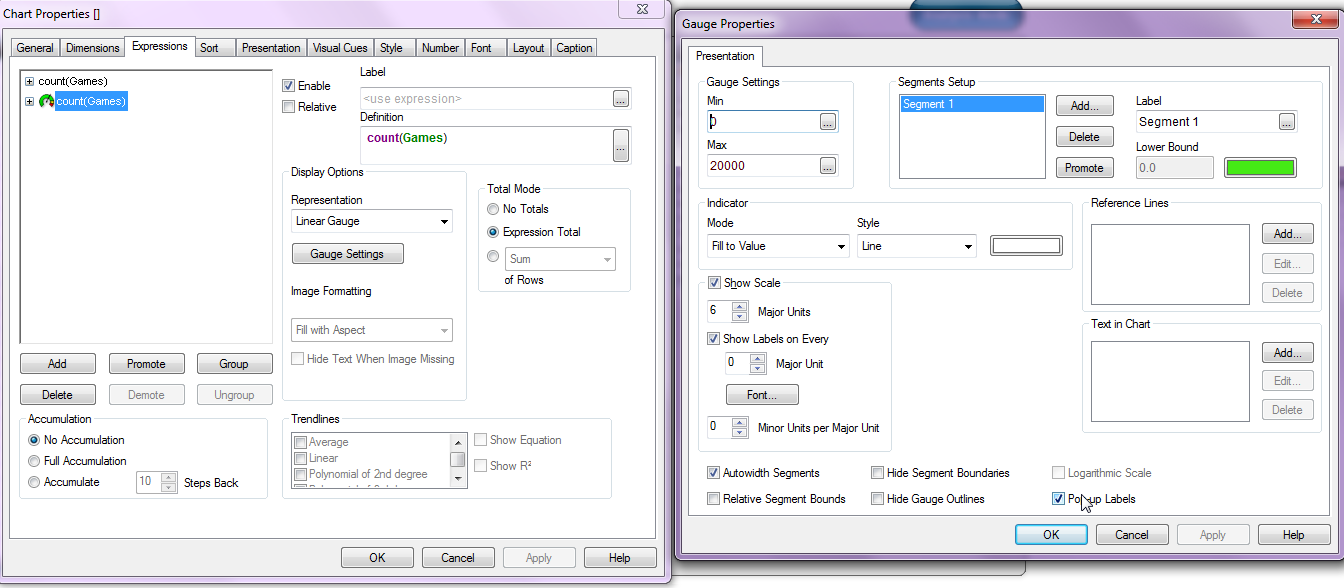
You need to copy the same expression and then you need to change the Representation as Linear Guage. Then click on the Guage Settings and you will see a new window. Under this window you will see Guage Properties, you need to change the Mode (Under Indicator) to Fill to Value. As you wanted to show the percentage(%) instead of actual values, you don't need to change the Min and Max values which are default to 0 and 1 respectively. However, you need to remove the Segment 2 from Segments Setup and you may change the color if you wanted to.
I am also attaching a screenshot of this window. I hope this helps!
Cheers - DV