Unlock a world of possibilities! Login now and discover the exclusive benefits awaiting you.
- Qlik Community
- :
- All Forums
- :
- QlikView App Dev
- :
- Re: Problem displaying scheduled hours
- Subscribe to RSS Feed
- Mark Topic as New
- Mark Topic as Read
- Float this Topic for Current User
- Bookmark
- Subscribe
- Mute
- Printer Friendly Page
- Mark as New
- Bookmark
- Subscribe
- Mute
- Subscribe to RSS Feed
- Permalink
- Report Inappropriate Content
Problem displaying scheduled hours
Hi,
I have a problem displaying scheduled hours.
My data looks like image below (also see attached QV file)...id, date_from, time_from, date_to, time_to
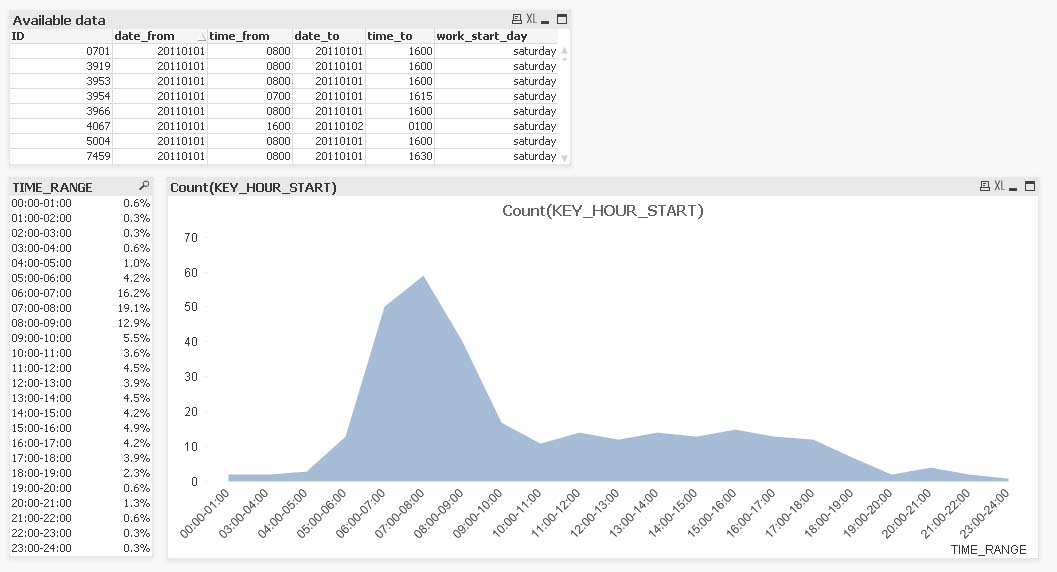
I want to use this information and display, in a chart (and table), how people schedule their hours, hour by hour.
So far I have been able to show when people start/finish ( see below), hour by hour...
But I really want to see when people are working (not just when they start or finish), hour by hour....
Like, how many people are working at a specifik time, hour by hour.
Anybody that knows how I can do that?
Any help is appreciated.
Also, see attached QV.
Thanks,
Johan
- « Previous Replies
-
- 1
- 2
- Next Replies »
- Mark as New
- Bookmark
- Subscribe
- Mute
- Subscribe to RSS Feed
- Permalink
- Report Inappropriate Content
I'm not sure if you need the aggr(). Probably not.
You may want to play around with
=count(DISTINCT if( HALFHOURS >= my_time_from and HALFHOURS < my_time_to ,ID ))
Here you should get the same result as with your aggr() function. count(distinct ..) is not very good performing, but there are some methods to overcome this.
For example, you could create a separate table with only unique IDs and a second field IDCounter with constant value 1. Then use a sum on this counter instead the count distinct.
or
=sum( if( HALFHOURS >= my_time_from and HALFHOURS < my_time_to ,1,0 ))
This should aggregate over all records, so if you select only one ID, you'll see the time of day where this ID worked frequently or only randomly.
Please see attached.
Stefan
- Mark as New
- Bookmark
- Subscribe
- Mute
- Subscribe to RSS Feed
- Permalink
- Report Inappropriate Content
Thanks. It was very interesting to see the difference between the expressions.
And thanks for explaining them.
The count(DISTINCT ..... does seem to give the same result as aggr().
I was especially surprised when I saw what this expression did:
=sum( if( HALFHOURS >= my_time_from and HALFHOURS < my_time_to ,1,0 ))
This is probably an even better way of doing what I want...looks like the result is "better".
//Johan
- Mark as New
- Bookmark
- Subscribe
- Mute
- Subscribe to RSS Feed
- Permalink
- Report Inappropriate Content
hi qv_johan
I´ve started an similar discussion of how many people were in a building at a specific time and it looks like your problem here is somewhat the same.
I got one question for you - what happens if there is a time that crosses a date ex.
mydatestart mytimestart mydateend mytimeend
2011-11-11 23:00 2011-11-12 02:00
could you please attach your final qvw file
- Mark as New
- Bookmark
- Subscribe
- Mute
- Subscribe to RSS Feed
- Permalink
- Report Inappropriate Content
Hi,
The final qvw file is the one that swuehl posted here. I add it to this reply too.
Sorry...but time that crosses a date haven't been a problem to me so I haven't thought about that.
But my guess is that it would just stop at midnight...not cross over and continue next date.
- Mark as New
- Bookmark
- Subscribe
- Mute
- Subscribe to RSS Feed
- Permalink
- Report Inappropriate Content
No, I think that these records will not be taken correctly into account.
If you look at the condition
if( HALFHOURS >= my_time_from and HALFHOURS < my_time_to ,1,0 )
and if you replace my_time_from and my_time_to with actual hours, in most records that will cross a date, my_time_to will be smaller than my_time_from, so above AND condition could not be fulfilled.
You could certainly work around this using additional check for a date crossing.
- Mark as New
- Bookmark
- Subscribe
- Mute
- Subscribe to RSS Feed
- Permalink
- Report Inappropriate Content
swuehl -
I posted a discussion some days ago and one several weeks ago but nobody seems to have a clue to solve my problem.
the post is : How many people were/are in the building.
Somewhat the same as this displaying scheduled hours.
For me I just want to calculate how many people is in the building a a specific time - using a login and logout data - which can spread over several days
- Mark as New
- Bookmark
- Subscribe
- Mute
- Subscribe to RSS Feed
- Permalink
- Report Inappropriate Content
Hi,
I am very happy with my application so far. But now i am trying to figure out how to check
for date crossing. Would I check for that inside this expression with another if condition?
if( HALFHOURS >= my_time_from and HALFHOURS < my_time_to ,1, NEW IF CONDITION HERE 0 )
- Mark as New
- Bookmark
- Subscribe
- Mute
- Subscribe to RSS Feed
- Permalink
- Report Inappropriate Content
Hi,
both John Witherspoon and me created different working solutions for polschou's similar request, so you just want to have a look into that:
http://community.qlik.com/thread/38841
Regards,
Stefan
- « Previous Replies
-
- 1
- 2
- Next Replies »