Unlock a world of possibilities! Login now and discover the exclusive benefits awaiting you.
- Qlik Community
- :
- All Forums
- :
- QlikView App Dev
- :
- Re: Distinct buckets
- Subscribe to RSS Feed
- Mark Topic as New
- Mark Topic as Read
- Float this Topic for Current User
- Bookmark
- Subscribe
- Mute
- Printer Friendly Page
- Mark as New
- Bookmark
- Subscribe
- Mute
- Subscribe to RSS Feed
- Permalink
- Report Inappropriate Content
Distinct buckets
Hi,
I am trying to create a pie chart that contains a distinct set of buckets. The dataset looks like:
Object ID Value Date
1234 0 01/01/2011
1234 1 02/01/2011
1234 1 03/01/2011
1234 0 04/01/2011
3456 0 01/01/2011
5678 0 01/01/2011
The value field is set at the transaction level, i.e. an Object ID can have a value of 1 and 0, but at different dates.
So the result of the pie chart should be 3 distinct Object IDs:
- 1 Object ID (1234) in Bucket A, i.e. 33.33%
- 2 Object IDs in Bucket B, i.e. 66.66%
I.e. Because Object ID 1234 contains at least one Value of 1, I would like to place it in the seperate bucket.
Currently, based on the dimension =if([Value]=1, 'Bucket A', 'Bucket B') with expression =count(distinct [Object ID]) returns 1 for Bucket A and 3 for Bucket B, which is 4 (Object ID 1234 is pushed into both buckets because it also contains 0 Values. The total distinct population of Object IDs should be 3.
Please can you help.
Thanks,
Aminul
- « Previous Replies
-
- 1
- 2
- Next Replies »
Accepted Solutions
- Mark as New
- Bookmark
- Subscribe
- Mute
- Subscribe to RSS Feed
- Permalink
- Report Inappropriate Content
Time to take your bucketing to the script, your UI will be too complicated otherwise. See attached.
For #2, that's too many dimensions for a bar chart, won't work. Try a straight or pivot table.
Regards,
Vlad
- Mark as New
- Bookmark
- Subscribe
- Mute
- Subscribe to RSS Feed
- Permalink
- Report Inappropriate Content
Try and see if this works as a dimension:
If(sum(aggr(Sum(Value),[Object ID]))>=1,'Bucket A','Bucket B')
- Mark as New
- Bookmark
- Subscribe
- Mute
- Subscribe to RSS Feed
- Permalink
- Report Inappropriate Content
I'm afraid it chucks up an //Error in calculated dimension.
If I may, I would also like to do something similar for another field called Consecutive. This field basically counts the number of days the data in another field is stale for, i.e.
Object ID Example value Consecutive Date
5678 3 0 01/02/2011
9101 6 0 01/02/2011
3111 7 0 01/02/2011
3111 7 1 02/02/2011
3111 7 2 03/02/2011
3111 7 3 04/02/2011
3111 8 0 05/02/2011
So my query would be something along the lines of chuck all of the distinct Object IDs with a Consecutive of > 2 into a distinct bucket, and throw the rest into a seperate bucket, but don't count any object IDs that have already been put into the first bucket.
- Mark as New
- Bookmark
- Subscribe
- Mute
- Subscribe to RSS Feed
- Permalink
- Report Inappropriate Content
Small correction to the syntax above:
aggr(if(sum(Value)>=1,'Bucket A','Bucket B'),[Object ID])
- Mark as New
- Bookmark
- Subscribe
- Mute
- Subscribe to RSS Feed
- Permalink
- Report Inappropriate Content
I'm afraid that only gives me back the total of the pie, with no breakdown of the buckets...
- Mark as New
- Bookmark
- Subscribe
- Mute
- Subscribe to RSS Feed
- Permalink
- Report Inappropriate Content
See attached
- Mark as New
- Bookmark
- Subscribe
- Mute
- Subscribe to RSS Feed
- Permalink
- Report Inappropriate Content
Thanks Vlad! That worked.
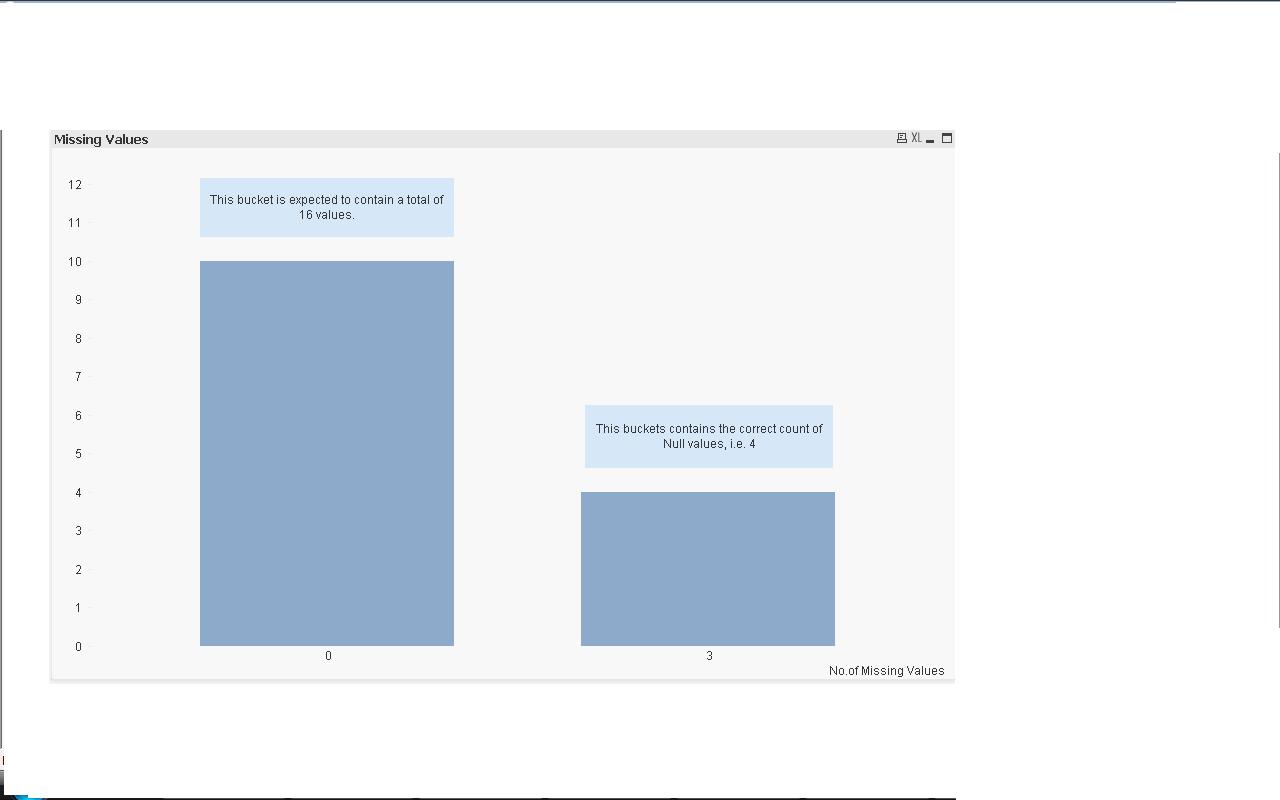
I have a related question in regards to grouping. I am trying to create a bar chart, which highlights the number of values associated with various buckets: a set for where values are missing in my data and 1 bucket (called '0') to also show how many actual values I do have.
The dataset is:
Category Object_ID Date Value Null_Marker Null_Consecutive Null_Total
ABCD 1234 01/01/2011 5 0 0 4
ABCD 1234 02/01/2011 6 0 0 4
ABCD 1234 03/01/2011 7 0 0 4
ABCD 1234 04/01/2011 NULL 1 0 4
ABCD 1234 05/01/2011 NULL 1 1 4
ABCD 1234 06/01/2011 NULL 1 2 4
ABCD 1234 07/01/2011 NULL 1 3 4
ABCD 1234 08/01/2011 10 0 0 4
ABCD 1234 09/01/2011 10 0 0 4
ABCD 1234 10/01/2011 10 0 0 4
EFGH 5678 01/01/2011 12 0 0 0
EFGH 5678 02/01/2011 14 0 0 0
EFGH 5678 03/01/2011 15 0 0 0
EFGH 5678 04/01/2011 15 0 0 0
EFGH 5678 05/01/2011 15 0 0 0
EFGH 5678 06/01/2011 15 0 0 0
EFGH 5678 07/01/2011 15 0 0 0
EFGH 5678 08/01/2011 15 0 0 0
EFGH 5678 09/01/2011 11 0 0 0
EFGH 5678 10/01/2011 10 0 0 0
The expression is:
if(sum([Null_Marker])>0,sum([Null_Marker]),count([Null_Marker]))
Dimension:
=aggr(if(sum([Null_Marker])>0,
if(sum([Null_Marker])>1,
if(Sum([Null_Marker])>2,
if(Sum([Null_Marker])>4,
if(sum([Null_Marker])>9,
if(sum([Null_Marker])>14,
if(sum([Null_Marker])>39,
if(sum([Null_Marker])>64,
'65', '40'),
'15'),
'10'),
'5'),
'3'),
'2'),
'1'),
'0'),
[Object_ID])
It calculates the missing values correctly and creates the correct buckets, as per the data. Except, for the object where there the above conditions are met, it removes the whole object from the '0' bucket, i.e. which contains both Null Marker = 0 and Null Marker = 1 values. Please see screen shot below:
- Mark as New
- Bookmark
- Subscribe
- Mute
- Subscribe to RSS Feed
- Permalink
- Report Inappropriate Content
It's a little confusing, but see attached. Is this what you were going for?
Regards,
Vlad
- Mark as New
- Bookmark
- Subscribe
- Mute
- Subscribe to RSS Feed
- Permalink
- Report Inappropriate Content
Thanks Vlad. That's exactly it, but I'm trying this in version 11 and it doesn't work...
- Mark as New
- Bookmark
- Subscribe
- Mute
- Subscribe to RSS Feed
- Permalink
- Report Inappropriate Content
I.e the zero bucket (actual) shows the same number as the Null bucket
- « Previous Replies
-
- 1
- 2
- Next Replies »