Unlock a world of possibilities! Login now and discover the exclusive benefits awaiting you.
- Qlik Community
- :
- All Forums
- :
- QlikView App Dev
- :
- Limited dimension axis in a line chart
- Subscribe to RSS Feed
- Mark Topic as New
- Mark Topic as Read
- Float this Topic for Current User
- Bookmark
- Subscribe
- Mute
- Printer Friendly Page
- Mark as New
- Bookmark
- Subscribe
- Mute
- Subscribe to RSS Feed
- Permalink
- Report Inappropriate Content
Limited dimension axis in a line chart
I have an apparently unescplicable problem
As you can see form the image below, I have two line charts which dispalys some data. In this image i have selected only one month (november, as higlited top right in the image) and it all works correctly.
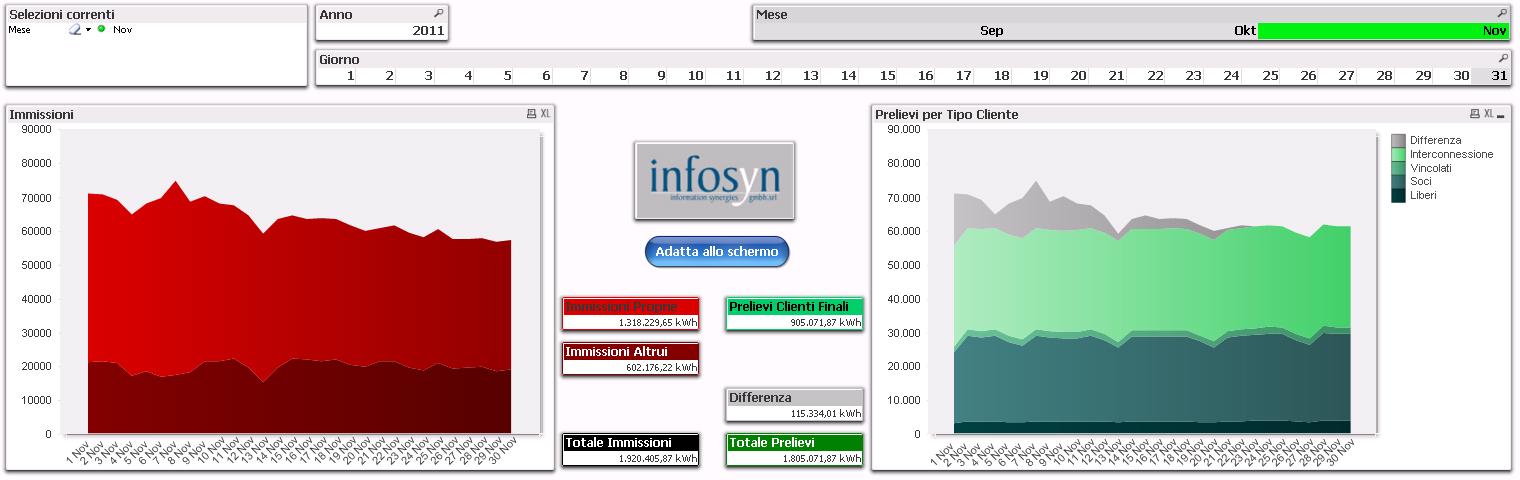
But if I select more months, like for example all the three that i can (Sept, Oct and Nov), here it's what i get:
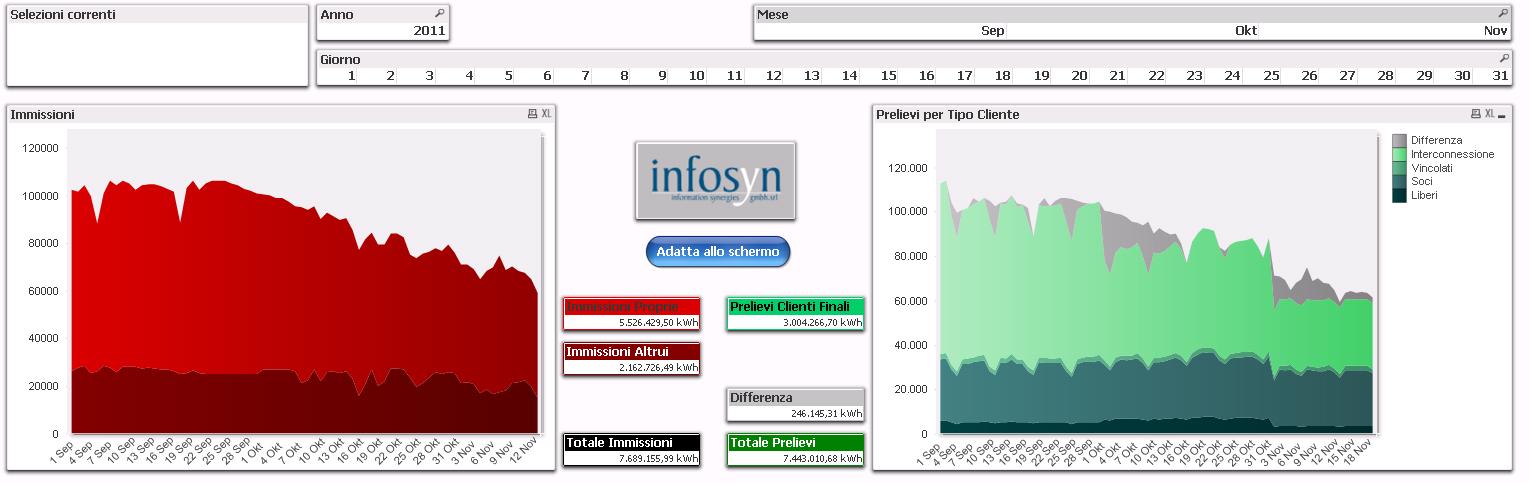
In the left graph the X-axis stops at 12 november, and in the right one it stops at 18
But as you could see before, i have all the november data loaded
I really cannot figure out what's the problem...
Hope that someone can help me
Thanks in advance,
Maikol
- Tags:
- new_to_qlikview
Accepted Solutions
- Mark as New
- Bookmark
- Subscribe
- Mute
- Subscribe to RSS Feed
- Permalink
- Report Inappropriate Content
I think there is limitation on shown data points in a line chart.
Try checking the option "continuous" for the dimension axis on axis tab. You may need to format the continuous axis on number tab accordingly.
Hope this helps,
Stefan
- Mark as New
- Bookmark
- Subscribe
- Mute
- Subscribe to RSS Feed
- Permalink
- Report Inappropriate Content
What do you mean with "format the continuous axis on number tab"?
I see there is such tab, and i see my "Continuous X-axis". I have tried setting it to Date, but the graph doesn't work ("no numeric values on x-axis")
I don't really understand what this tab is used for..
What should I set?
- Mark as New
- Bookmark
- Subscribe
- Mute
- Subscribe to RSS Feed
- Permalink
- Report Inappropriate Content
I assumed that you are using a date type value with numerical representation, formatted with Date() function to a text representation like you want (e.g. 'D MMM' to get something like '1 Sep').
How have you created your values?
- Mark as New
- Bookmark
- Subscribe
- Mute
- Subscribe to RSS Feed
- Permalink
- Report Inappropriate Content
The value used as X-axis is defined this way:
Day(LPAC_DAT_LETT)&' '&month(LPAC_DAT_LETT) as Periodo
where LPAC_DAT_LETT is a date filed in my DB
so for example i get "7 Nov" fot the 7th of November
- Mark as New
- Bookmark
- Subscribe
- Mute
- Subscribe to RSS Feed
- Permalink
- Report Inappropriate Content
Try using
Date(LPAC_DAT_LETT, 'D MMM') as Periodo
This should format your dates in the wanted way, like "7 Nov", but will keep the numerical date representation also, thus allowing a continuous axis (in my opinion, it is always better to do it that way, so you could still use all the date time functions and you can calculate on dates also (add, subtract))
- Mark as New
- Bookmark
- Subscribe
- Mute
- Subscribe to RSS Feed
- Permalink
- Report Inappropriate Content
Great! It works 😃
But there's one small thing i still don't understand:
This way i get the "7 Nov" format if i have no selection, but i get the dd.mm.yyy format if i select just one month
Is this expected?
- Mark as New
- Bookmark
- Subscribe
- Mute
- Subscribe to RSS Feed
- Permalink
- Report Inappropriate Content
Interesting.
For some reason, QV will not regard the format set in number tab for the continuous axis but the standard date format. Seems that is somehow dependent on the range of dimension values to be shown (I just set up a small sample and the change in formatting takes place somewhere between selecting 3-4 months).
To me, it seems like a bug (and the only workaround seems to be setting the standard date format to 'D MMM' too, not sure if this is feasible solution).
- Mark as New
- Bookmark
- Subscribe
- Mute
- Subscribe to RSS Feed
- Permalink
- Report Inappropriate Content
Ok now it all works perfectly (Setting the standard date format)
Many thanks for all the suggestions!