Unlock a world of possibilities! Login now and discover the exclusive benefits awaiting you.
- Qlik Community
- :
- All Forums
- :
- QlikView App Dev
- :
- Date Grouping
- Subscribe to RSS Feed
- Mark Topic as New
- Mark Topic as Read
- Float this Topic for Current User
- Bookmark
- Subscribe
- Mute
- Printer Friendly Page
- Mark as New
- Bookmark
- Subscribe
- Mute
- Subscribe to RSS Feed
- Permalink
- Report Inappropriate Content
Date Grouping
Hi,
I am new to Qlikview and am working on a personal project to understand QV better.
I have had the standard QV training available n-line but need a little help.
I am importing transaction data from an SQLite Table and there is a field called TRANSACTION_DATE that I have imported.
I have also created a seperate calendar table using the script below:
[Calendar]:
LOAD *, Month(TRANSACTION_DATE) as TRANSACTION_MONTH, Year(TRANSACTION_DATE) as TRANSACTION_YEAR;
LOAD date(fieldvalue('TRANSACTION_DATE',RecNo())) as TRANSACTION_DATE AUTOGENERATE fieldvaluecount('TRANSACTION_DATE');
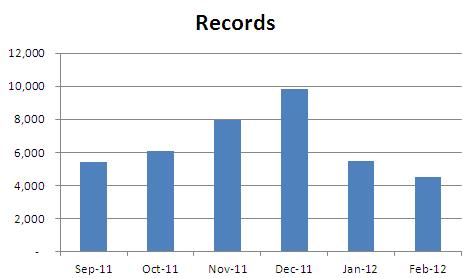
My concern is that this will group dates as months but the sequencing of TRANSACTION_MONTH will be lost once I record transactions in January'2012. In short, JAN, FEB etc... will start apperating before SEP, OCT, NOV, DEC on the chart.
I would like the dates to be represented as MMM-YY on the dimesion axis so that the sequence of TRANSACTION_MONTH can be maintained.
I am attaching here, an excel chart representation of how I would like the data to be seen in QV:
- Mark as New
- Bookmark
- Subscribe
- Mute
- Subscribe to RSS Feed
- Permalink
- Report Inappropriate Content
hi there
just make a composite key
load
*,
Month(TRANSACTION_DATE)&'-'& Year(TRANSACTION_DATE) as key
from,,,,
may it helps you
thanks
rohit
- Mark as New
- Bookmark
- Subscribe
- Mute
- Subscribe to RSS Feed
- Permalink
- Report Inappropriate Content
Hi,
I'm not sure you try this yet : DATE(TRANSACTION_DATE,'MM-YY') AS [%KEY]
Regards,
Sokkorn Cheav
- Mark as New
- Bookmark
- Subscribe
- Mute
- Subscribe to RSS Feed
- Permalink
- Report Inappropriate Content
Thanks Rohit.
I used your logic and created a composite date key as below:
Year(TRANSACTION_DATE) & '-' & num(Month(TRANSACTION_DATE)) as TRANSACTION_YEARMONTH
- Mark as New
- Bookmark
- Subscribe
- Mute
- Subscribe to RSS Feed
- Permalink
- Report Inappropriate Content
Hi,
Add a calculated Dimension in a bar chart.... & write...
=Date(TRANSACTION_DATE,'MMM-YY')
Regards,
Parag