Unlock a world of possibilities! Login now and discover the exclusive benefits awaiting you.
- Qlik Community
- :
- All Forums
- :
- QlikView App Dev
- :
- Chart - Two dimensions - Two Expressions
- Subscribe to RSS Feed
- Mark Topic as New
- Mark Topic as Read
- Float this Topic for Current User
- Bookmark
- Subscribe
- Mute
- Printer Friendly Page
- Mark as New
- Bookmark
- Subscribe
- Mute
- Subscribe to RSS Feed
- Permalink
- Report Inappropriate Content
Chart - Two dimensions - Two Expressions
Hi,
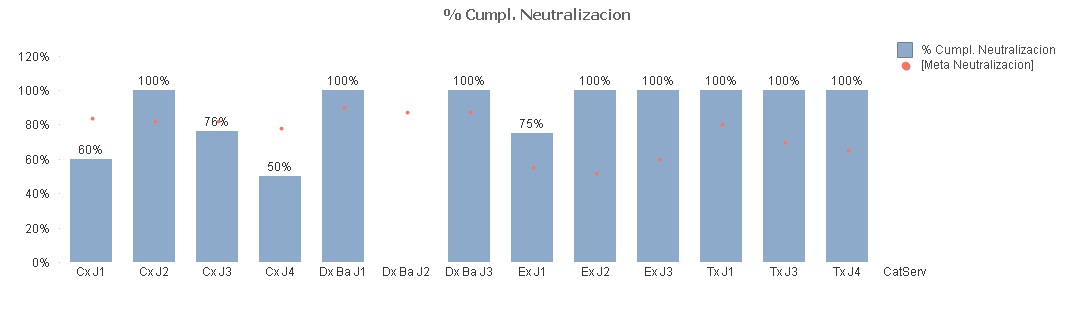
I'm trying to create a chart that shows current performance and expected performance like in the attached picture (SLA).
I'm stuck with the line chart. It doesn't show correctly the points along the second dimension.
Thanks in advance.
- Mark as New
- Bookmark
- Subscribe
- Mute
- Subscribe to RSS Feed
- Permalink
- Report Inappropriate Content
Yes, that's a known limitation with line charts, two dimensions and multiple expressions.
The only way I know around this is trying to create ONE dimension out of the two, e.g. using concatenation.
I remember vaguely a post by John Wihterspoon that also tried to simulate the visual appearance of actually having two dimensions, by only showing the first dimension once per segment or something like this.
But unfortunately, I wasn't able to found this post in the forum tonight...
- Mark as New
- Bookmark
- Subscribe
- Mute
- Subscribe to RSS Feed
- Permalink
- Report Inappropriate Content
I used your suggestion.
Now the chart looks like this. Just what I wanted.
Thanks.
- Mark as New
- Bookmark
- Subscribe
- Mute
- Subscribe to RSS Feed
- Permalink
- Report Inappropriate Content
Hi Jorge,
THats great to see that you got this critical solution. I'm facing the same issue in my project. It will be helpful if you can post the steps with an example. Thanks in advance.
Regards,
Joy