Unlock a world of possibilities! Login now and discover the exclusive benefits awaiting you.
- Qlik Community
- :
- All Forums
- :
- QlikView App Dev
- :
- Sum of multiple categories
- Subscribe to RSS Feed
- Mark Topic as New
- Mark Topic as Read
- Float this Topic for Current User
- Bookmark
- Subscribe
- Mute
- Printer Friendly Page
- Mark as New
- Bookmark
- Subscribe
- Mute
- Subscribe to RSS Feed
- Permalink
- Report Inappropriate Content
Sum of multiple categories
Hi to all!
I'm not able to make Qlikview doing a sum...I have a field "PTBRAND" that can show the following values: desktop, mobile, server, options....
I am trying to obtain a graph of quantities with the sum of desktop, mobile and server to be compared to the sum of options quantities......
Please help!!
Thanks!
Accepted Solutions
- Mark as New
- Bookmark
- Subscribe
- Mute
- Subscribe to RSS Feed
- Permalink
- Report Inappropriate Content
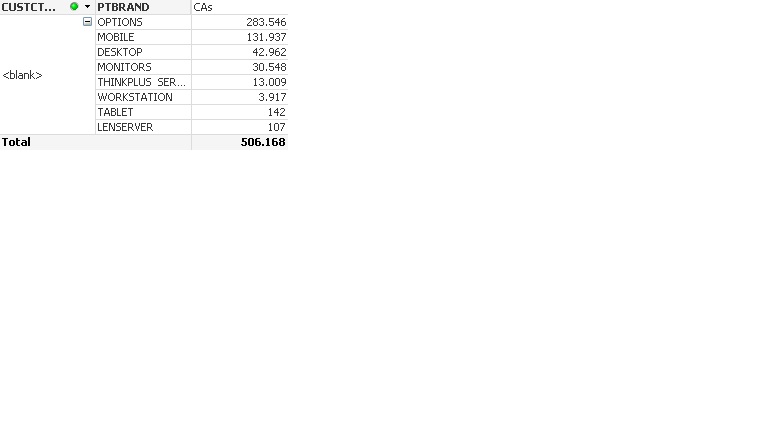
Ok, you have an additionally field CAs with number you want to sum, right?
It is a bit more comfortable to post such data as text, e.g. with an inline table:
LOAD *
INLINE [
PTBRAND, CAs
OPTIONS, 283546
MOBILE, 131937
DESKTOP, 42962
MONITORS, 30548
THINKPLUS SERVER, 13009
WORKSTATION, 3917
TABLET, 142
LENSERVER, 107
];
From this, I created a small demo app, with a straight table chart with calculated dimension
=if(match(PTBRAND,'OPTIONS'),'OPTIONS','HARDWARE')
and expression
=sum(CAs)
Please see attached.
This resulted in a table with two line:
| =if(match(PTBRAND,'OPTIONS'),'OPTIONS','HARDWARE') | sum(CAs) |
|---|---|
| 506168 | |
| OPTIONS | 283546 |
| HARDWARE | 222622 |
Hope this helps,
Stefan
- Mark as New
- Bookmark
- Subscribe
- Mute
- Subscribe to RSS Feed
- Permalink
- Report Inappropriate Content
You could create a calculated dimension, create a chart object, go to dimension tab and add a calculated dimension:
=if( match(PTBRAND,'desktop','mobile','server'), 'OverallComputer','Options')
then, as expression:
=count(PTBRAND)
[Not sure, is this what you want to count, or do you have another field you want to count sum?]
Regards,
Stefan
- Mark as New
- Bookmark
- Subscribe
- Mute
- Subscribe to RSS Feed
- Permalink
- Report Inappropriate Content
Thanks for the reply, I tried but it doesn't work....I have the "PTBRAND" field with the desktop, mobile, server, options values and quantities and I am trying to aggregate desktop, mobile and server as machines to be compared to the options in order to check how many optionscompared to the "machines" were sold....
I tried your script but it doesn't work....
Thanks
- Mark as New
- Bookmark
- Subscribe
- Mute
- Subscribe to RSS Feed
- Permalink
- Report Inappropriate Content
Thanks for the reply, I tried but it doesn't work....I have the "PTBRAND" field with the desktop, mobile, server, options values and quantities and I am trying to aggregate desktop, mobile and server as machines to be compared to the options in order to check how many options compared to the "machines" were sold....
I tried your script but it doesn't work....
Thanks
- Mark as New
- Bookmark
- Subscribe
- Mute
- Subscribe to RSS Feed
- Permalink
- Report Inappropriate Content
Up to now, I suggested starting with object expressions in the front end, no load script modification involved.
It seems that I don't really understand your data, could you post a small data sample? Just some lines of your table?
- Mark as New
- Bookmark
- Subscribe
- Mute
- Subscribe to RSS Feed
- Permalink
- Report Inappropriate Content
 Here it is!
- Mark as New
- Bookmark
- Subscribe
- Mute
- Subscribe to RSS Feed
- Permalink
- Report Inappropriate Content
Here it is!
- Mark as New
- Bookmark
- Subscribe
- Mute
- Subscribe to RSS Feed
- Permalink
- Report Inappropriate Content
Ok, you have an additionally field CAs with number you want to sum, right?
It is a bit more comfortable to post such data as text, e.g. with an inline table:
LOAD *
INLINE [
PTBRAND, CAs
OPTIONS, 283546
MOBILE, 131937
DESKTOP, 42962
MONITORS, 30548
THINKPLUS SERVER, 13009
WORKSTATION, 3917
TABLET, 142
LENSERVER, 107
];
From this, I created a small demo app, with a straight table chart with calculated dimension
=if(match(PTBRAND,'OPTIONS'),'OPTIONS','HARDWARE')
and expression
=sum(CAs)
Please see attached.
This resulted in a table with two line:
| =if(match(PTBRAND,'OPTIONS'),'OPTIONS','HARDWARE') | sum(CAs) |
|---|---|
| 506168 | |
| OPTIONS | 283546 |
| HARDWARE | 222622 |
Hope this helps,
Stefan
- Mark as New
- Bookmark
- Subscribe
- Mute
- Subscribe to RSS Feed
- Permalink
- Report Inappropriate Content
Great! Thanks a lot!