Unlock a world of possibilities! Login now and discover the exclusive benefits awaiting you.
- Qlik Community
- :
- All Forums
- :
- QlikView App Dev
- :
- Problem with Aggr() (example file included)
- Subscribe to RSS Feed
- Mark Topic as New
- Mark Topic as Read
- Float this Topic for Current User
- Bookmark
- Subscribe
- Mute
- Printer Friendly Page
- Mark as New
- Bookmark
- Subscribe
- Mute
- Subscribe to RSS Feed
- Permalink
- Report Inappropriate Content
Problem with Aggr() (example file included)
Hi, I am having some weird behavior using the Aggr() function, as fas as I know, it should execute an expression based on a dimension, so
aggr(
expr1
,Dim1
)
expr1 will be executed the number of times that Dim1 exist, but for some weird reason, it does not work as expected on the attached file, please download it and see how can I achieve the expected result. 
Basically the scenario is the following:
I have some data loaded in an inline table:
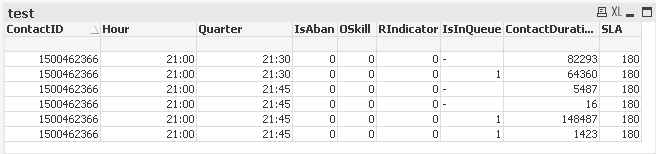
As you see its the same ContactID, same Hour, but sometimes different Quarter.
I am adding the following set analysis since I want to group it by 2 dimensions inside a pivot chart:
sum(
aggr(
if(
Sum({$<IsInQueue={1}>}ContactDurationQH) < num(ServiceLevelAgreement*1000)
,1
,10
)
,ContactID
)
)
Basically this is asking:
"If the sum of ContactDurationQH flagged as IsInqueue for the current subset of data is less than the ServiceLevelAgreement by 1000, output a 1, if not, a 10"
But is is not working as expected:
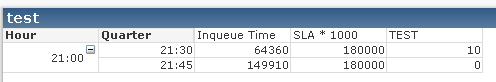
As a matter of fact, it is returning a 10 in the first row, which is wrong, since the sum is less than SLA * 1000, and in the second, it's not even returning valid data from the IF
Any idea of what is going on?
Thanks in advance for the time.
Regards
-ed
- Mark as New
- Bookmark
- Subscribe
- Mute
- Subscribe to RSS Feed
- Permalink
- Report Inappropriate Content
- Mark as New
- Bookmark
- Subscribe
- Mute
- Subscribe to RSS Feed
- Permalink
- Report Inappropriate Content
Thanks a lot Scott, I think I forgot to mention that in my source tabe there will be tons of Contacts sharing the same hours and quarters, that's why I used Aggr.
-ed
- Mark as New
- Bookmark
- Subscribe
- Mute
- Subscribe to RSS Feed
- Permalink
- Report Inappropriate Content
Does any one has any idea why this exmple cannot work using AGGR() ? 
Suggestions?
Regards
-ed
- Mark as New
- Bookmark
- Subscribe
- Mute
- Subscribe to RSS Feed
- Permalink
- Report Inappropriate Content
Finally I got a solution from QV Support, its using dimensionality():
if(Dimensionality()=2,
aggr(
if(
Sum({$<IsInQueue={1}>}ContactDurationQH) < num(ServiceLevelAgreement*1000)
,1
,10
)
,Quarter),
if(Dimensionality()=1,
aggr(
if(
Sum({$<IsInQueue={1}>}ContactDurationQH) < num(ServiceLevelAgreement*1000)
,1
,10
)
,Hour))
)
But I have been using Aggr() on many other expressions in cunjuction with Pivot charts, this is the first time that I'll have to include this new function "Dimensionality", have any of you played around with it?
I just want to double check if this is the best approch towards solving my issue.
Regards,
-ed