Unlock a world of possibilities! Login now and discover the exclusive benefits awaiting you.
- Qlik Community
- :
- All Forums
- :
- QlikView App Dev
- :
- Help with bubble chart axis position and bubbles d...
Options
- Subscribe to RSS Feed
- Mark Topic as New
- Mark Topic as Read
- Float this Topic for Current User
- Bookmark
- Subscribe
- Mute
- Printer Friendly Page
Turn on suggestions
Auto-suggest helps you quickly narrow down your search results by suggesting possible matches as you type.
Showing results for
Not applicable
2012-01-19
05:47 AM
- Mark as New
- Bookmark
- Subscribe
- Mute
- Subscribe to RSS Feed
- Permalink
- Report Inappropriate Content
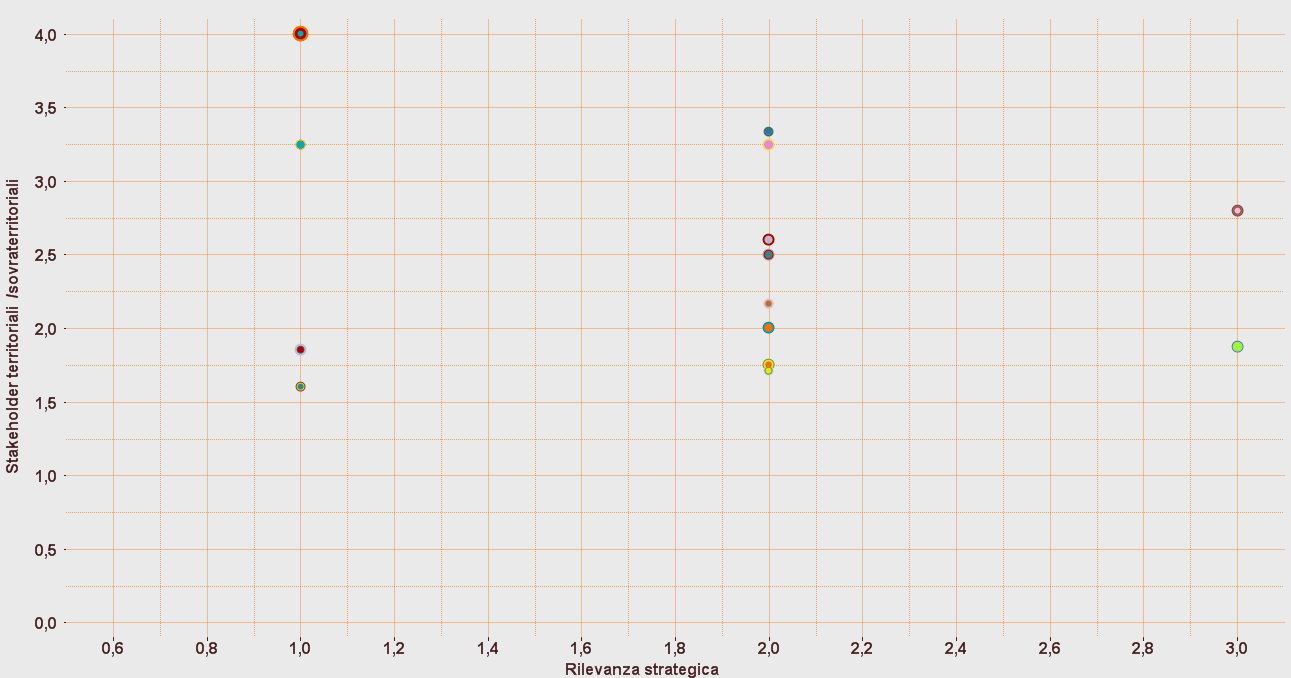
Help with bubble chart axis position and bubbles dimension
Hi everyone,
I nedd some help in setting this bubble chart.
What I'd want is:
- Set the axis in a calculated position, like the median value for each axis (the output should be a carthesian chart)
- Make the bubbles look bigger. Their size is set by the third dimension, but they look too little.
Each bubble is a business process (list of processes set as a dimension), the axis and the bubble size are 3 aspects that characterize them (set as expressions)
Thanks to everyone who will help
Messaggio modificato da sulisqlik
1,353 Views
1 Solution
Accepted Solutions
Not applicable
2012-01-19
06:49 AM
Author
- Mark as New
- Bookmark
- Subscribe
- Mute
- Subscribe to RSS Feed
- Permalink
- Report Inappropriate Content
I've solved both the problems.
- Adding Lines to the chart and making the axis invisible.
- Unchecking the "authomatic symble size" box and setting an higher maximum size
317 Views
1 Reply
Not applicable
2012-01-19
06:49 AM
Author
- Mark as New
- Bookmark
- Subscribe
- Mute
- Subscribe to RSS Feed
- Permalink
- Report Inappropriate Content
I've solved both the problems.
- Adding Lines to the chart and making the axis invisible.
- Unchecking the "authomatic symble size" box and setting an higher maximum size
318 Views