Unlock a world of possibilities! Login now and discover the exclusive benefits awaiting you.
- Qlik Community
- :
- All Forums
- :
- QlikView App Dev
- :
- Dynamic accumulation of the last 12 Months.
- Subscribe to RSS Feed
- Mark Topic as New
- Mark Topic as Read
- Float this Topic for Current User
- Bookmark
- Subscribe
- Mute
- Printer Friendly Page
- Mark as New
- Bookmark
- Subscribe
- Mute
- Subscribe to RSS Feed
- Permalink
- Report Inappropriate Content
Dynamic accumulation of the last 12 Months.
Hello,
Please anyone can help me to solve this problem:
How I can process a dynamic accumulation of TurnOver for the last 12 months
- By using dimensions : Months and Years
- But without using accumulation option
However, I tried to do that with using theoption: accumulation (12 steps Back) and using one dimension:(YEARS_MONTHS_REF) and it works.
Indeed, through this method I can get the relevant dynamic accumulation for the last 12 months.
But my boss doesn’t want this kind ofpresentation. He needs a Chart with two dimensions. I put an accent that i needto get the dynamic accumulation for the last 12 Months and not only the value for month.
The following chart shows the result that Ineed to get
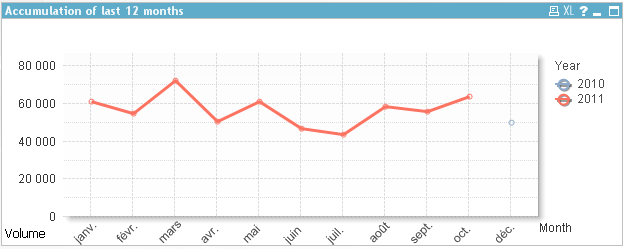
To be more clear, for example, if we are in October 2011, I should get the accumulation of TurnOver from November 2010 to October 2011.
It’s really pressing 
Thanks for help
- Mark as New
- Bookmark
- Subscribe
- Mute
- Subscribe to RSS Feed
- Permalink
- Report Inappropriate Content
I think you could get your accumulated value using rangesum() function together with above() chart inter record function.
I created some sample data using
LOAD *, Month(Date) as Month, year(Date) as Year;
LOAD
Date(makedate(2011)+recno()-1) as Date,
ceil(RAND()*100 ) as Value
AutoGenerate 700;
Then I created a line chart with dimensions Month and Year to match what I think is shown in your image.
The expression to accumulate the last 12 months then looks like:
=aggr(rangesum(above(total sum(Value),0,12)),Year,Month)
The important part here is the rangesum(above(total sum(Value),0,12)) function that will sum the last 12 Values in a table, for each line (last values means the 12 lines above the current line, thus we use the above() function).
Since I believe you are showing dimensions in the order Month, Year in your chart, but we want to group by Year, Month, I added an additional advanced aggregation to correct for this.
You will notice that the acculated line will have a steep slope for the first 12 Month, since we accumulate the last 12 Month and there is not enough data for these month, so Jan 2011 will only accumulate 1 month, Feb 2012 2 months etc.
See also attached.
Stefan