Unlock a world of possibilities! Login now and discover the exclusive benefits awaiting you.
- Qlik Community
- :
- All Forums
- :
- QlikView App Dev
- :
- TRICKY: Waterfall chart with variable X and Y dime...
- Subscribe to RSS Feed
- Mark Topic as New
- Mark Topic as Read
- Float this Topic for Current User
- Bookmark
- Subscribe
- Mute
- Printer Friendly Page
- Mark as New
- Bookmark
- Subscribe
- Mute
- Subscribe to RSS Feed
- Permalink
- Report Inappropriate Content
TRICKY: Waterfall chart with variable X and Y dimension
Hi,
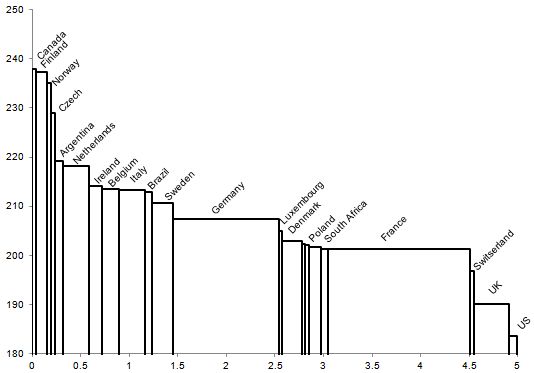
I know, this is sick, would something similar be possible in Qlikview? I haven't found a solution.
So what you see are the prices on the Y-axis and the amount of volumes sold on the X-axis.
In summary, the graph shows how much volume is sold, and at what price, in one chart.
Accepted Solutions
- Mark as New
- Bookmark
- Subscribe
- Mute
- Subscribe to RSS Feed
- Permalink
- Report Inappropriate Content
hi,
What version of qlikview you are using? If you are using Qlikview 10 or 11, I think this would be possible by using the Mekko chart.
Hope this helps you.
Regards,
Jagan.
- Mark as New
- Bookmark
- Subscribe
- Mute
- Subscribe to RSS Feed
- Permalink
- Report Inappropriate Content
hi,
What version of qlikview you are using? If you are using Qlikview 10 or 11, I think this would be possible by using the Mekko chart.
Hope this helps you.
Regards,
Jagan.
- Mark as New
- Bookmark
- Subscribe
- Mute
- Subscribe to RSS Feed
- Permalink
- Report Inappropriate Content
Hi,
This is Mekko chart in QlikView.
- Mark as New
- Bookmark
- Subscribe
- Mute
- Subscribe to RSS Feed
- Permalink
- Report Inappropriate Content
Thanks! I should definitely upgrade my QV!!!