Unlock a world of possibilities! Login now and discover the exclusive benefits awaiting you.
- Qlik Community
- :
- All Forums
- :
- QlikView App Dev
- :
- Relative evolution with oldest value as reference ...
- Subscribe to RSS Feed
- Mark Topic as New
- Mark Topic as Read
- Float this Topic for Current User
- Bookmark
- Subscribe
- Mute
- Printer Friendly Page
- Mark as New
- Bookmark
- Subscribe
- Mute
- Subscribe to RSS Feed
- Permalink
- Report Inappropriate Content
Relative evolution with oldest value as reference point
I want to create a graph which shows the evolution of values of different products in time, relative to the oldest value (earliest time stamp, which is not necessarily on the first row of the source tabel) of the source data.
The data are given in intervals, but this issue has been solved by Swuehl.
So I already have a graph showing the absolute evolution of the data in time. As a next step, I'd like them to be compared to the first value of the corresponding product, because of the wide range of absolute values. Furthermore, the relative changes are on a same level so this graphic shoud become more interesting this way.
does anyone have a suggestion on how to clear this issue ?
Thanks in advance for the ideas.
Accepted Solutions
- Mark as New
- Bookmark
- Subscribe
- Mute
- Subscribe to RSS Feed
- Permalink
- Report Inappropriate Content
You indeed have overlapping intervals, so I think you should clarify how to handle the 1 day your intervals overlap (which value to take for that date). That's the reason why you get the outlier at those days when using the sum(Value) expression.
For example, if you want to use the value from the ending interval, you could use [I had some problems loading your excel file, so you might need to adjust the first load]:
TMPPRODUCT:
LOAD Product,
[m max unit/h],
unit,
[valid from],
[valid until],
[mmax from here]
FROM
Mmax_PEOL_v3.xls.xlsx
(ooxml, embedded labels, table is Sheet1);
Product:
NOCONCATENATE LOAD Product,
[m max unit/h],
unit,
if(Peek(Product)=Product and peek([valid until])=[valid from], [valid from]+1, [valid from]) as [valid from],
[valid until],
[mmax from here]
resident TMPPRODUCT order by Product, [valid from];
drop table TMPPRODUCT;
Calendar:
LOAD
Date(makedate(2010)+RecNo()-1) as Date
autogenerate 1000;
IntervalMatch (Date) Load [valid from], [valid until] resident Product;
and if you want to use the value from the coming period, you need to change the sort order of [valid from] and change the LOAD to
Product:
NOCONCATENATE LOAD Product,
[m max unit/h],
unit,
if(Peek(Product)=Product and [valid until]=peek([valid from]), [valid until]-1, [valid until]) as [valid until],
[valid from],
[mmax from here]
resident TMPPRODUCT order by Product, [valid from] desc;
That will correct your absolute value display per Date and Product, but that was not the problem with the relative display, we need to use [valid from] as sort weight to FirstSortedValue, use
=[m max unit/h] / FirstSortedValue(total<Product> [m max unit/h], [valid from])
as expression in your chart.
I am attaching the sample app, though you can't really use it with your personal edition without losing a recovery attempt.
Regards,
Stefan
- Mark as New
- Bookmark
- Subscribe
- Mute
- Subscribe to RSS Feed
- Permalink
- Report Inappropriate Content
Hi,
I'm not sure if I grasped the problem completely. But you should sort your fact table by date/time. In order to read data linked to first and/or last available date in your selections, use the FIRSTSORTEDVALUE function.
Hope this helps you further.
Regards,
sebablum
- Mark as New
- Bookmark
- Subscribe
- Mute
- Subscribe to RSS Feed
- Permalink
- Report Inappropriate Content
Maybe like attached? I just replaced the expression with
=sum(Value) / FirstSortedValue(total<Product> Value, Date)
Regards,
Stefan
edit: removed the aggr(), not needed here
- Mark as New
- Bookmark
- Subscribe
- Mute
- Subscribe to RSS Feed
- Permalink
- Report Inappropriate Content
Hi Stefan,
I tried this formula, but as a result I only become the requested line for just 1 product. The other products are not shown.
Kind regards,
Stijn
- Mark as New
- Bookmark
- Subscribe
- Mute
- Subscribe to RSS Feed
- Permalink
- Report Inappropriate Content
Have you looked at my sample? There is a list box with Product values. Have you cleared the selection? My sample seems to work at my place. Or are you talking about different data set?
- Mark as New
- Bookmark
- Subscribe
- Mute
- Subscribe to RSS Feed
- Permalink
- Report Inappropriate Content
hey Stefan,
I've got problems opening your sample. Perhaps because I currently use the personal edition, which doesn't allow to open files made by others. Could you perhaps post the programming on the forum (or as screenshot) ?
Thanks in advance for the help. The data are not the ones I posted, but are similar. The headings are the same though.
- Mark as New
- Bookmark
- Subscribe
- Mute
- Subscribe to RSS Feed
- Permalink
- Report Inappropriate Content
The script part is identical to the one I posted here:
http://community.qlik.com/thread/47196
Then just create a line chart with dimensions Date and Product and 1 expression like posted above:
=sum(Value) / FirstSortedValue(total<Product> Value, Date)
The result looks like
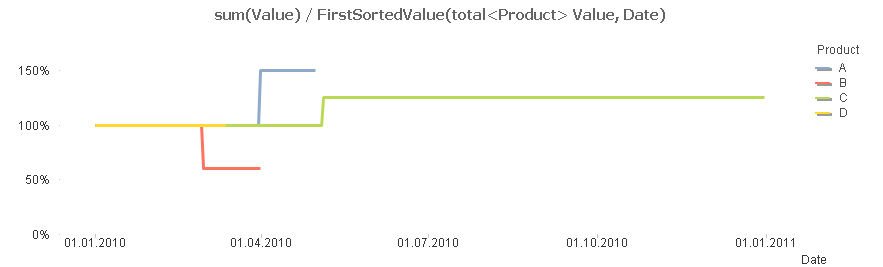
Are you using more than one expression? Line charts are pretty limited in displaying multiple dimensions / expressions.
Regards,
Stefan
- Mark as New
- Bookmark
- Subscribe
- Mute
- Subscribe to RSS Feed
- Permalink
- Report Inappropriate Content
Do you have overlapping / same intervals for the same Product? For example, is 'unit' something like a subgroup of product? Could you extend your sample data that it match your actual data layout?
The FirstSortedValue will not work if you could have several Values for one given date, like same or overlapping intervals per Product.
- Mark as New
- Bookmark
- Subscribe
- Mute
- Subscribe to RSS Feed
- Permalink
- Report Inappropriate Content
You indeed have overlapping intervals, so I think you should clarify how to handle the 1 day your intervals overlap (which value to take for that date). That's the reason why you get the outlier at those days when using the sum(Value) expression.
For example, if you want to use the value from the ending interval, you could use [I had some problems loading your excel file, so you might need to adjust the first load]:
TMPPRODUCT:
LOAD Product,
[m max unit/h],
unit,
[valid from],
[valid until],
[mmax from here]
FROM
Mmax_PEOL_v3.xls.xlsx
(ooxml, embedded labels, table is Sheet1);
Product:
NOCONCATENATE LOAD Product,
[m max unit/h],
unit,
if(Peek(Product)=Product and peek([valid until])=[valid from], [valid from]+1, [valid from]) as [valid from],
[valid until],
[mmax from here]
resident TMPPRODUCT order by Product, [valid from];
drop table TMPPRODUCT;
Calendar:
LOAD
Date(makedate(2010)+RecNo()-1) as Date
autogenerate 1000;
IntervalMatch (Date) Load [valid from], [valid until] resident Product;
and if you want to use the value from the coming period, you need to change the sort order of [valid from] and change the LOAD to
Product:
NOCONCATENATE LOAD Product,
[m max unit/h],
unit,
if(Peek(Product)=Product and [valid until]=peek([valid from]), [valid until]-1, [valid until]) as [valid until],
[valid from],
[mmax from here]
resident TMPPRODUCT order by Product, [valid from] desc;
That will correct your absolute value display per Date and Product, but that was not the problem with the relative display, we need to use [valid from] as sort weight to FirstSortedValue, use
=[m max unit/h] / FirstSortedValue(total<Product> [m max unit/h], [valid from])
as expression in your chart.
I am attaching the sample app, though you can't really use it with your personal edition without losing a recovery attempt.
Regards,
Stefan
- Mark as New
- Bookmark
- Subscribe
- Mute
- Subscribe to RSS Feed
- Permalink
- Report Inappropriate Content
Hello Stefan,
thanks again for this helpful solution. The result is as I wished it !
Regards