Unlock a world of possibilities! Login now and discover the exclusive benefits awaiting you.
- Qlik Community
- :
- All Forums
- :
- QlikView App Dev
- :
- Who to change de color of those bars in a grafic c...
- Subscribe to RSS Feed
- Mark Topic as New
- Mark Topic as Read
- Float this Topic for Current User
- Bookmark
- Subscribe
- Mute
- Printer Friendly Page
- Mark as New
- Bookmark
- Subscribe
- Mute
- Subscribe to RSS Feed
- Permalink
- Report Inappropriate Content
Who to change de color of those bars in a grafic chart that's under some target?
I need to know who to change de color of those bars in a grafic chart that's under some target as, for exemple, the monthly sales target for each vendor.
- Tags:
- new_to_qlikview
- Mark as New
- Bookmark
- Subscribe
- Mute
- Subscribe to RSS Feed
- Permalink
- Report Inappropriate Content
Hi,
To define colors to change according to a target, you need to go to Chart properties --> Visual Cues --> Select the expression and specify your target in Upper and/or Lower. Select your color appropriately.
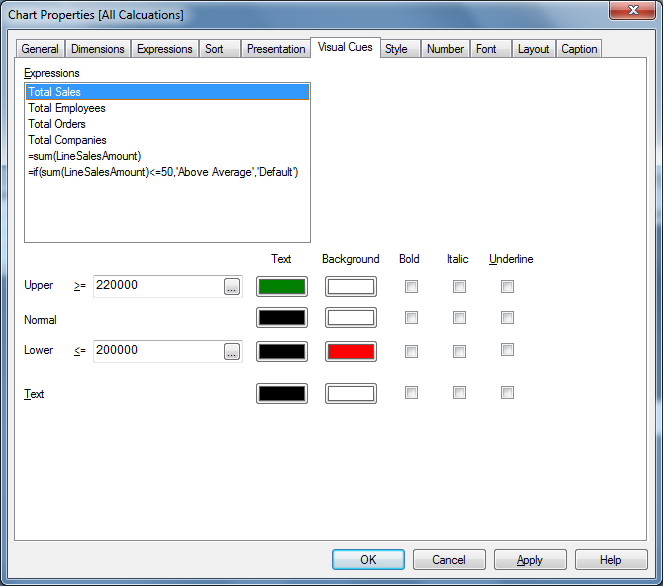
However, this probably only works for a straight table and a pivot table. Is that what you are looking for?
Regards,
-Khaled.
- Mark as New
- Bookmark
- Subscribe
- Mute
- Subscribe to RSS Feed
- Permalink
- Report Inappropriate Content
HI,
In addition to the solution provided by khaled, you can also change the color in the expression tab by adding the condition like
if (Target <0,red(), if(target >0 and target <50 , rgb(100,132,143),rgb(222,65,66)))
You need to add the condition in the defination tab on right.
Attach is the screen shot for the same.
Deepak
- Mark as New
- Bookmark
- Subscribe
- Mute
- Subscribe to RSS Feed
- Permalink
- Report Inappropriate Content
Hi
Hope the attached file will be used to solve your doubt
Regards
Ashok