Unlock a world of possibilities! Login now and discover the exclusive benefits awaiting you.
- Qlik Community
- :
- All Forums
- :
- QlikView App Dev
- :
- Re: Design a last year current year diagram
Options
- Subscribe to RSS Feed
- Mark Topic as New
- Mark Topic as Read
- Float this Topic for Current User
- Bookmark
- Subscribe
- Mute
- Printer Friendly Page
Turn on suggestions
Auto-suggest helps you quickly narrow down your search results by suggesting possible matches as you type.
Showing results for
Not applicable
2012-02-29
05:55 PM
- Mark as New
- Bookmark
- Subscribe
- Mute
- Subscribe to RSS Feed
- Permalink
- Report Inappropriate Content
Design a last year current year diagram
Hi togehter,
which is the best method to meet the following requirement ?
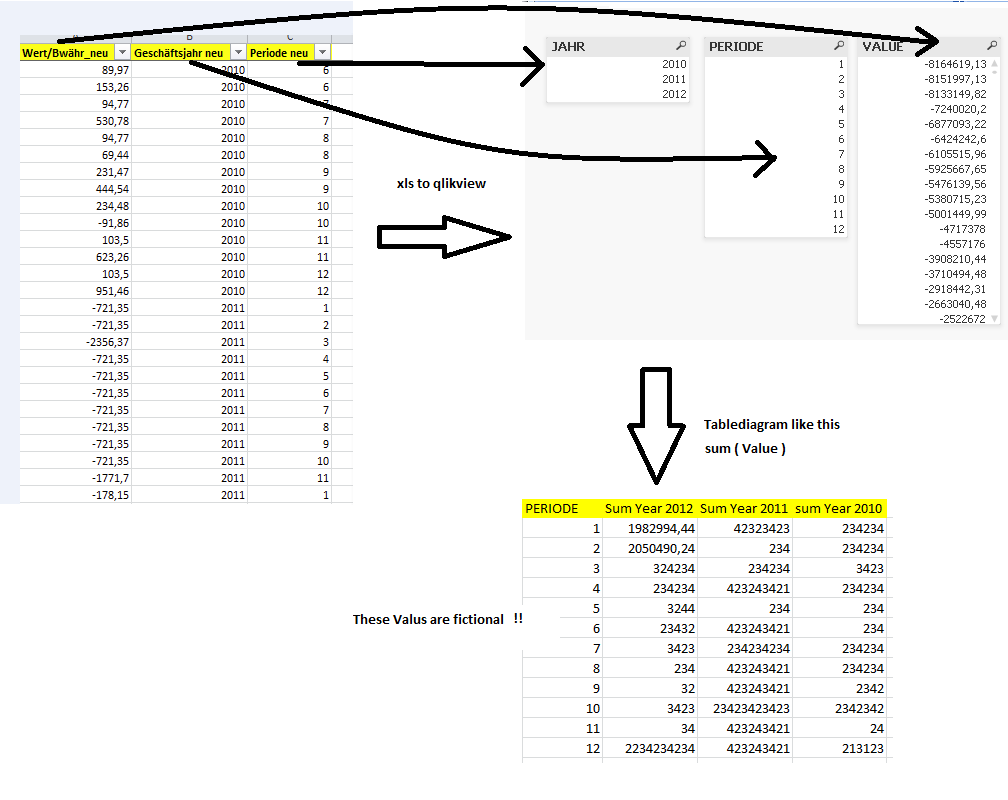
What is the best guide to action ? Can somebody use the attached example.qvw to show the best way.
Thank you very much !
601 Views
3 Replies
Not applicable
2012-02-29
08:51 PM
Author
- Mark as New
- Bookmark
- Subscribe
- Mute
- Subscribe to RSS Feed
- Permalink
- Report Inappropriate Content
You simply add a Chart (Pivot Table) and pull the year column above the values so that the values sum for each year.
See attached example.
Ingo.
192 Views
Specialist
2012-03-01
12:45 AM
- Mark as New
- Bookmark
- Subscribe
- Mute
- Subscribe to RSS Feed
- Permalink
- Report Inappropriate Content
Hi,
I attached sample QV file based on your requirment. Hope its helpful for u.
Regards,
Iyyappan
192 Views
Anonymous
Not applicable
2012-03-01
12:55 AM
Author
- Mark as New
- Bookmark
- Subscribe
- Mute
- Subscribe to RSS Feed
- Permalink
- Report Inappropriate Content
Hi
Here i attached the qv file , hope this will helpful for your requirement
I done your requirement using the straight table and set analysis
Regards,
Ashok
192 Views