Unlock a world of possibilities! Login now and discover the exclusive benefits awaiting you.
- Qlik Community
- :
- All Forums
- :
- QlikView App Dev
- :
- Minimised Chart Disappears - Behind Other Objects
- Subscribe to RSS Feed
- Mark Topic as New
- Mark Topic as Read
- Float this Topic for Current User
- Bookmark
- Subscribe
- Mute
- Printer Friendly Page
- Mark as New
- Bookmark
- Subscribe
- Mute
- Subscribe to RSS Feed
- Permalink
- Report Inappropriate Content
Minimised Chart Disappears - Behind Other Objects
Hi
I'm using QV10 on 64 bit windows server 2008
I'm working on a sheet but have decided I want to minimise the three charts on it in order to make them larger and display them individually. One is fine and goes to an icon that I can drag and drop to a convenient place but the other two disappear. I've tried changing the layout to top layer but this makes no difference. I don't want to pull the whole sheet apart looking for them if they have indeed gone behind the other list boxes, text boxes, seach dialougues etc. any thoughts anyone?
Cheers
Geoff
Accepted Solutions
- Mark as New
- Bookmark
- Subscribe
- Mute
- Subscribe to RSS Feed
- Permalink
- Report Inappropriate Content
Like Celambarasan mentioned, you can make it a custom layer in the Layout tab, and choose something greater than 1.
If that doesnt work, try going to the caption tab of each chart, choosing the minimized option from the dropdown menu on the bottom left, and changing the X and Y coordinates of the chart. You should be able to move it somewhere that you can see it. See my screenshot attached.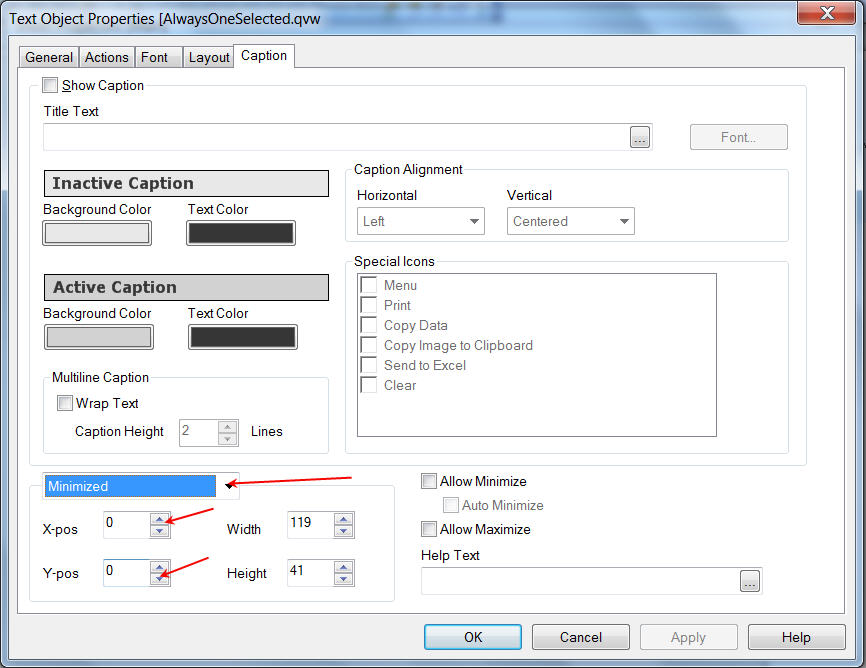
- Mark as New
- Bookmark
- Subscribe
- Mute
- Subscribe to RSS Feed
- Permalink
- Report Inappropriate Content
Hi,
You have to make it to top layer after minimizing the chart.have you tried in that way?.
Celambarasan
- Mark as New
- Bookmark
- Subscribe
- Mute
- Subscribe to RSS Feed
- Permalink
- Report Inappropriate Content
Hi
Yup - no dice.
- Mark as New
- Bookmark
- Subscribe
- Mute
- Subscribe to RSS Feed
- Permalink
- Report Inappropriate Content
Hi Celambarasan
Good thought but no dice.
Cheers
Geoff
- Mark as New
- Bookmark
- Subscribe
- Mute
- Subscribe to RSS Feed
- Permalink
- Report Inappropriate Content
Hi,
Have you checked by increasing the custom Layer option as more than 2.
Layout --> Under Layer --->Custom option as 3 or more after minimizing it.
Celambarasan
- Mark as New
- Bookmark
- Subscribe
- Mute
- Subscribe to RSS Feed
- Permalink
- Report Inappropriate Content
Like Celambarasan mentioned, you can make it a custom layer in the Layout tab, and choose something greater than 1.
If that doesnt work, try going to the caption tab of each chart, choosing the minimized option from the dropdown menu on the bottom left, and changing the X and Y coordinates of the chart. You should be able to move it somewhere that you can see it. See my screenshot attached.
- Mark as New
- Bookmark
- Subscribe
- Mute
- Subscribe to RSS Feed
- Permalink
- Report Inappropriate Content
Thanks Phersan
That was to easy ;-)> There are just so many tabs/sections/checkboxs ... to rummage through.
Cheers
Geoff