Unlock a world of possibilities! Login now and discover the exclusive benefits awaiting you.
- Qlik Community
- :
- All Forums
- :
- QlikView App Dev
- :
- Scatter Chart Axis
- Subscribe to RSS Feed
- Mark Topic as New
- Mark Topic as Read
- Float this Topic for Current User
- Bookmark
- Subscribe
- Mute
- Printer Friendly Page
- Mark as New
- Bookmark
- Subscribe
- Mute
- Subscribe to RSS Feed
- Permalink
- Report Inappropriate Content
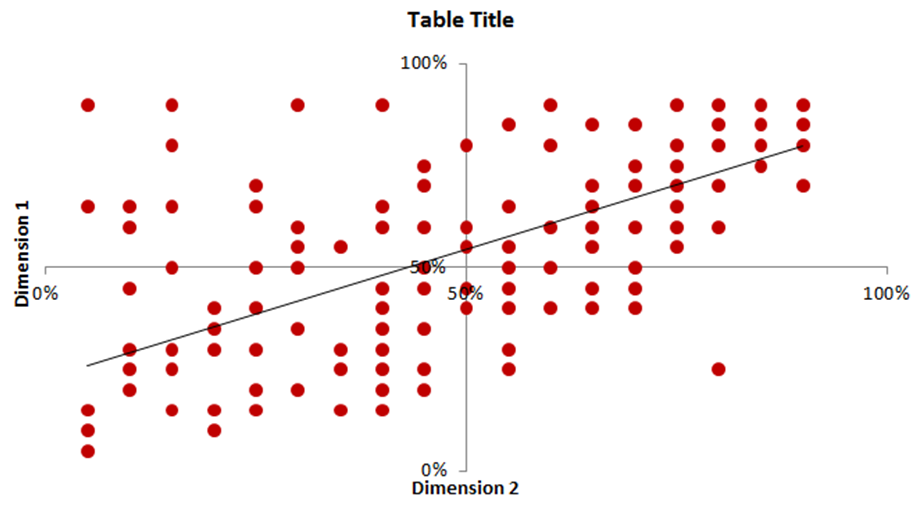
Scatter Chart Axis
I need to create a 4-quadrant scatter chart as pictured below. All of my values between 0.0 and 1.0. How do I create a chart in QlikView that allows me to set up this 4-quadrant type chart?
Accepted Solutions
- Mark as New
- Bookmark
- Subscribe
- Mute
- Subscribe to RSS Feed
- Permalink
- Report Inappropriate Content
Go to presentation panel then Reference Line
add 2 lines
Enter 0.5 for X, the 0.5 for Y.
You can also add an expression or a fractile
JJ
- Mark as New
- Bookmark
- Subscribe
- Mute
- Subscribe to RSS Feed
- Permalink
- Report Inappropriate Content
Go to presentation panel then Reference Line
add 2 lines
Enter 0.5 for X, the 0.5 for Y.
You can also add an expression or a fractile
JJ
- Mark as New
- Bookmark
- Subscribe
- Mute
- Subscribe to RSS Feed
- Permalink
- Report Inappropriate Content
Thank you!
I also had to set a fixed axis on both the X- and Y- to a min of 0 and a max of 1.
- Mark as New
- Bookmark
- Subscribe
- Mute
- Subscribe to RSS Feed
- Permalink
- Report Inappropriate Content
Hello,
Do you have some example of this chart?
Thank you
JGG
- Mark as New
- Bookmark
- Subscribe
- Mute
- Subscribe to RSS Feed
- Permalink
- Report Inappropriate Content
Properties--------> axes---------> scale and set static min and static max for x and y axis