Unlock a world of possibilities! Login now and discover the exclusive benefits awaiting you.
- Qlik Community
- :
- All Forums
- :
- QlikView App Dev
- :
- individual sum percentage
- Subscribe to RSS Feed
- Mark Topic as New
- Mark Topic as Read
- Float this Topic for Current User
- Bookmark
- Subscribe
- Mute
- Printer Friendly Page
- Mark as New
- Bookmark
- Subscribe
- Mute
- Subscribe to RSS Feed
- Permalink
- Report Inappropriate Content
individual sum percentage
hi all,
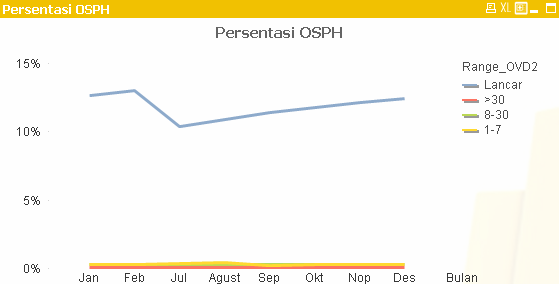
i'm new in qlikview set analyst function, i have a case where i need to show the range percentage "each month" in one chart
dimensions are RANGE and MONTH,
the expression is : (SUM(OSPHNPLNew) / SUM(total OSPHNPLNew))
then the result seems the percentage of OSPH by total (osph/total osph) (max y value = 15 %)
i need a set analyst to show the real value (max y value = 100 %) for each month .
can somebody help me ? thank you 
- « Previous Replies
-
- 1
- 2
- Next Replies »
- Mark as New
- Bookmark
- Subscribe
- Mute
- Subscribe to RSS Feed
- Permalink
- Report Inappropriate Content
Ok navarone,done.
Go to the expressions and replace what you have in "percentage" with this formula:
sum(OSPHNPLBaru)/aggr(nodistinct sum(OSPHNPLBaru),month)
I hope this helps.
- Mark as New
- Bookmark
- Subscribe
- Mute
- Subscribe to RSS Feed
- Permalink
- Report Inappropriate Content
thank you qlikuser14, may i have your YM?
so i can ask you directly next time
- Mark as New
- Bookmark
- Subscribe
- Mute
- Subscribe to RSS Feed
- Permalink
- Report Inappropriate Content

- « Previous Replies
-
- 1
- 2
- Next Replies »