Unlock a world of possibilities! Login now and discover the exclusive benefits awaiting you.
- Qlik Community
- :
- All Forums
- :
- QlikView App Dev
- :
- Aggregate Table in Qlikview
- Subscribe to RSS Feed
- Mark Topic as New
- Mark Topic as Read
- Float this Topic for Current User
- Bookmark
- Subscribe
- Mute
- Printer Friendly Page
- Mark as New
- Bookmark
- Subscribe
- Mute
- Subscribe to RSS Feed
- Permalink
- Report Inappropriate Content
Aggregate Table in Qlikview
Dear All,
For a Dashboard, I need to create an Aggregate Table. Can I create it in Qlikview and update values to it?
Your suggestions are really very much appreciated!!
Thanks & Regards,
Saravana Prabhu
- Tags:
- qlikview_scripting
- Mark as New
- Bookmark
- Subscribe
- Mute
- Subscribe to RSS Feed
- Permalink
- Report Inappropriate Content
Can you be more specific? Aggregation is certainly possible but how depends on your requirements. In the script is best, unless the aggregation will depend on user selections. What do you need to achieve and can you post a sample of your app?
- Mark as New
- Bookmark
- Subscribe
- Mute
- Subscribe to RSS Feed
- Permalink
- Report Inappropriate Content
Thanks for your reply..
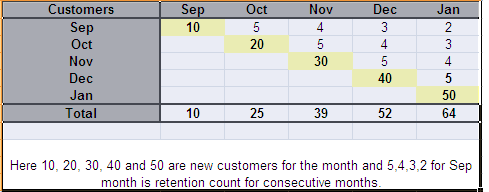
Actually in a table, customer id, purchase date and some other columns are there, we need to create an cutomer attrition dashboard using this table. So far that we planned to create an aggregate table as below.
- Mark as New
- Bookmark
- Subscribe
- Mute
- Subscribe to RSS Feed
- Permalink
- Report Inappropriate Content
Hi
You can get the look you want with a pivot table. Drag one of the date headers to the top of the table to create the cross table.
You can colour the diagonal using the expression background colour. Something like
If(month1 = month2, yellow())
(assuming month1 and month2 are the two date dimensions)
Regards
Jonathan