Unlock a world of possibilities! Login now and discover the exclusive benefits awaiting you.
- Qlik Community
- :
- All Forums
- :
- QlikView App Dev
- :
- To get consistent colors for same options
- Subscribe to RSS Feed
- Mark Topic as New
- Mark Topic as Read
- Float this Topic for Current User
- Bookmark
- Subscribe
- Mute
- Printer Friendly Page
- Mark as New
- Bookmark
- Subscribe
- Mute
- Subscribe to RSS Feed
- Permalink
- Report Inappropriate Content
To get consistent colors for same options
I am preparing a chart to show the count of responses against a couple of survey questions.
One question, named Q_23 is like "whats your rating on the performance" . The answer to the question is meant to be anything from 0 to 10.
The answer feild [Response] contains values other than 0 to 10 also (that pertains to other questions which has response like probably, always, never etc)
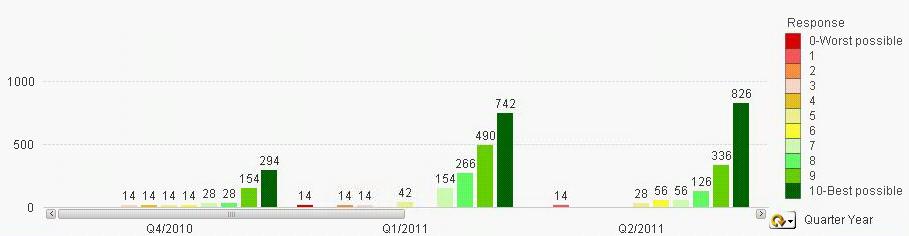
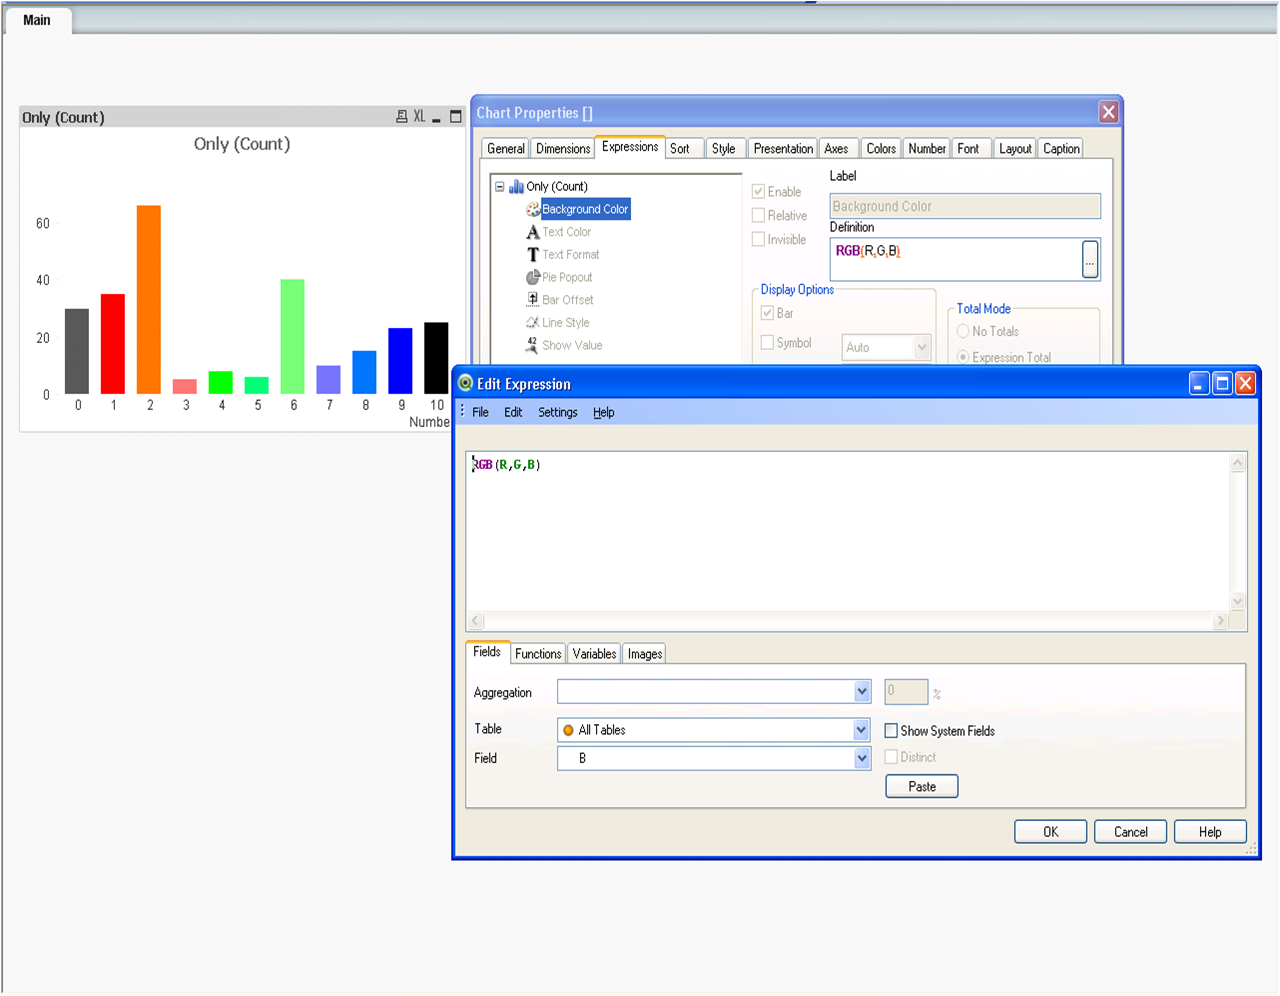
Ideally the Q_23 chat should be displayed as shown here..(and for me it does display like this when there is no selection)
Now the problem happens when I select few filters. When there are no values for a few options, it disappears and show something like
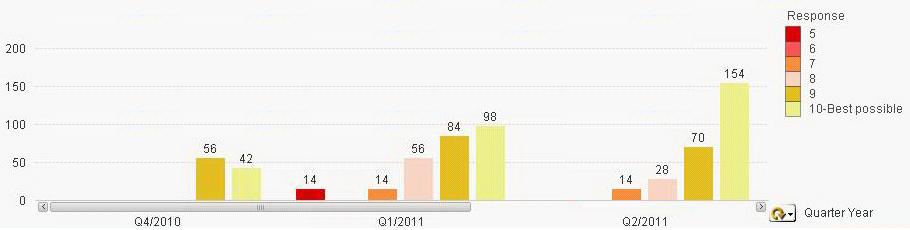
This is totally unacceptable as the color coding (red for the worst and green for the best) totaly disobeys.
As a solution , I thought of two options
1) the legend should show all the 11 options even if there is no value against that. I hope, if I can achieve this, the color code will be followed.
2) there should be some mechanism to map each color to each option so that even if few options are not there, the options that are present will be shown in their correct color.
To try out my first option, I tried going to 'dimensions' tab and uncheck 'suppress null values', check 'show all values' ..then went to 'presentation tab' and checked 'show zero on bars' .  this is not helping me and the result is the same as above.
The dimension I gave is a calculated dimension as given below ..(I have done so because else the other response values like 'always', 'probably' etc will appear in legend when I check the 'show all values' in dimensions tab)
Calculated dimension : =if([Response]='0-Worst possible' or [Response]='1' or [Response]='2' or [Response]='3' or [Response]='4' or [Response]='5' or [Response]='6' or [Response]='7' or [Response]='8' or [Response]='9' or [Response]='10-Best possible',[Response])
The expression : Count({<Question={'Q_23'}>}[Response])
Regarding 2nd option, that is the possibility of mapping colors to the 11 options, I dont have a slightest clue if this is possible and how.
This could be a very simple problem..I anticipate any experienced qlikview friend to help me out soon.
Thanks,
sircute.
Accepted Solutions
- Mark as New
- Bookmark
- Subscribe
- Mute
- Subscribe to RSS Feed
- Permalink
- Report Inappropriate Content
hi,
i think this can be solved by providing fixed colour to your expression,
just expend expression and add condition in background color:
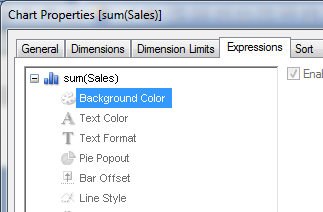
Like if(([Response]='0-Worst possible' or [Response]='1' , rgb(10,0,0),if(.....))
Regards
Arun Goel
- Mark as New
- Bookmark
- Subscribe
- Mute
- Subscribe to RSS Feed
- Permalink
- Report Inappropriate Content
Hi,
Check the persistent colors option in the Color Tab which is below the Multicolored Check box.
Celambarasan
- Mark as New
- Bookmark
- Subscribe
- Mute
- Subscribe to RSS Feed
- Permalink
- Report Inappropriate Content
Hi Chelambarasan,
I checked persistent colors option, but it is not shown as expected (see the legend)
The expected ranking is what has been given in 'data appearence' section ..this is not the ranking when it comes in legend.
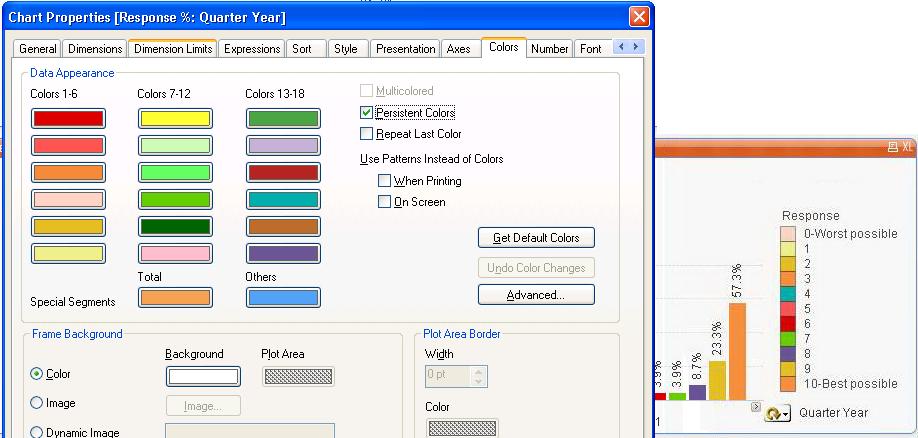
Normaly, I give the order of colors in 'data appearence' in the same sequence which i expect in chart. When we use persistent colors options, does anything else need to be adjusted?
- Mark as New
- Bookmark
- Subscribe
- Mute
- Subscribe to RSS Feed
- Permalink
- Report Inappropriate Content
hi,
i think this can be solved by providing fixed colour to your expression,
just expend expression and add condition in background color:
Like if(([Response]='0-Worst possible' or [Response]='1' , rgb(10,0,0),if(.....))
Regards
Arun Goel
- Mark as New
- Bookmark
- Subscribe
- Mute
- Subscribe to RSS Feed
- Permalink
- Report Inappropriate Content
Hi Arun,
That actually worked 
Thank you so much.
I gave, under 'background color' , the expression
=if([Response]='0-Worst possible',rgb(217,0,0),
if([Response]='1',rgb(255,85,85),
if([Response]='2',rgb(247,139,60),
if([Response]='3',rgb(248,211,194),
if([Response]='4',rgb(227,188,32),
if([Response]='5',rgb(236,238,138),
if([Response]='6',rgb(255,255,55),
if([Response]='7',rgb(205,248,177),
if([Response]='8',rgb(98,255,98),
if([Response]='9',rgb(102,204,0),
if([Response]='10-Best possible',rgb(0,100,0)
)))))))))))
For the time being I am implementing this. But, this seems to be a work around. There shoud be some easier way to achive this using 'persistent colors' option.
I hope, anyone who's an expert in color section might help me with it here.
- Mark as New
- Bookmark
- Subscribe
- Mute
- Subscribe to RSS Feed
- Permalink
- Report Inappropriate Content
hi,
i doesn't know wht logic others use, but what i use in my tools is that i upload the colors in the QV file and apply it to the charts that having an option to change the color code vary easily in the excel, pic see the attached example file, and the way
- Mark as New
- Bookmark
- Subscribe
- Mute
- Subscribe to RSS Feed
- Permalink
- Report Inappropriate Content
Hi mohammeds,
that too is a very smart way to map colors to bars in the sequence that we want.
Thanks for sharing
- Mark as New
- Bookmark
- Subscribe
- Mute
- Subscribe to RSS Feed
- Permalink
- Report Inappropriate Content
Nice!! Thanks for sharing! Have a great day