Unlock a world of possibilities! Login now and discover the exclusive benefits awaiting you.
- Qlik Community
- :
- All Forums
- :
- QlikView App Dev
- :
- Making a pie graph based on information from diffe...
Options
- Subscribe to RSS Feed
- Mark Topic as New
- Mark Topic as Read
- Float this Topic for Current User
- Bookmark
- Subscribe
- Mute
- Printer Friendly Page
Turn on suggestions
Auto-suggest helps you quickly narrow down your search results by suggesting possible matches as you type.
Showing results for
Not applicable
2012-05-09
06:07 AM
- Mark as New
- Bookmark
- Subscribe
- Mute
- Subscribe to RSS Feed
- Permalink
- Report Inappropriate Content
Making a pie graph based on information from different column
Hi there,
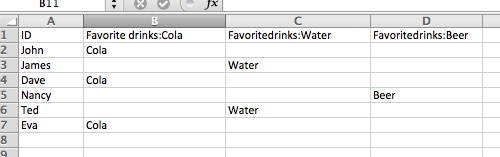
How would I be able to make a pie graph that shows the frequency of the drinks mentioned?
This should be easy I guess, I'm just not familiar with the way the data is stored.
thanks!
453 Views
3 Replies
MVP
2012-05-09
06:26 AM
- Mark as New
- Bookmark
- Subscribe
- Mute
- Subscribe to RSS Feed
- Permalink
- Report Inappropriate Content
Hi,
I suggest if you want to create a pie chart create crosstable of this data and the create a pie chart. In your example
Cola has 3 frequency,
Water has 2 frequency,
Beer has 1 frequency.
Create crosstable like
CrossTable(FV_Cola, Data)
LOAD Id,
FV_Cola,
FV_Water,
FV_Beer
FROM
Source File.
HTH
Reagrds
Anand
208 Views
Not applicable
2012-05-09
06:35 AM
Author
- Mark as New
- Bookmark
- Subscribe
- Mute
- Subscribe to RSS Feed
- Permalink
- Report Inappropriate Content
Thanks man!
208 Views
MVP
2012-05-09
06:50 AM
- Mark as New
- Bookmark
- Subscribe
- Mute
- Subscribe to RSS Feed
- Permalink
- Report Inappropriate Content
Hi,
Thanks, If you got correct answer so mark it correct so other can see it.
Regards,
Anand
208 Views