Unlock a world of possibilities! Login now and discover the exclusive benefits awaiting you.
- Qlik Community
- :
- All Forums
- :
- QlikView App Dev
- :
- Finding the number of days between the first and l...
- Subscribe to RSS Feed
- Mark Topic as New
- Mark Topic as Read
- Float this Topic for Current User
- Bookmark
- Subscribe
- Mute
- Printer Friendly Page
- Mark as New
- Bookmark
- Subscribe
- Mute
- Subscribe to RSS Feed
- Permalink
- Report Inappropriate Content
Finding the number of days between the first and last day of a dimension after a selection
Hi Community,
I have a sum(sales) expression, date dimension line graph that I'm showing accumulated totals for. When I make selextions, some of the dates at the bottom go away. Is there away I can tell hown may days are showing in the date dimension of the graph?
If not, Is there a way to keep the graph hard coded to a certain size for a certain period of dates and have the accumulations start on the first day and end on the last day for both the expression?
Regards,
Brandon
- Mark as New
- Bookmark
- Subscribe
- Mute
- Subscribe to RSS Feed
- Permalink
- Report Inappropriate Content
Hi Brandon,
Please can you post sample QV document?
Thanks - DV
- Mark as New
- Bookmark
- Subscribe
- Mute
- Subscribe to RSS Feed
- Permalink
- Report Inappropriate Content
Wish I could but the document is too big.
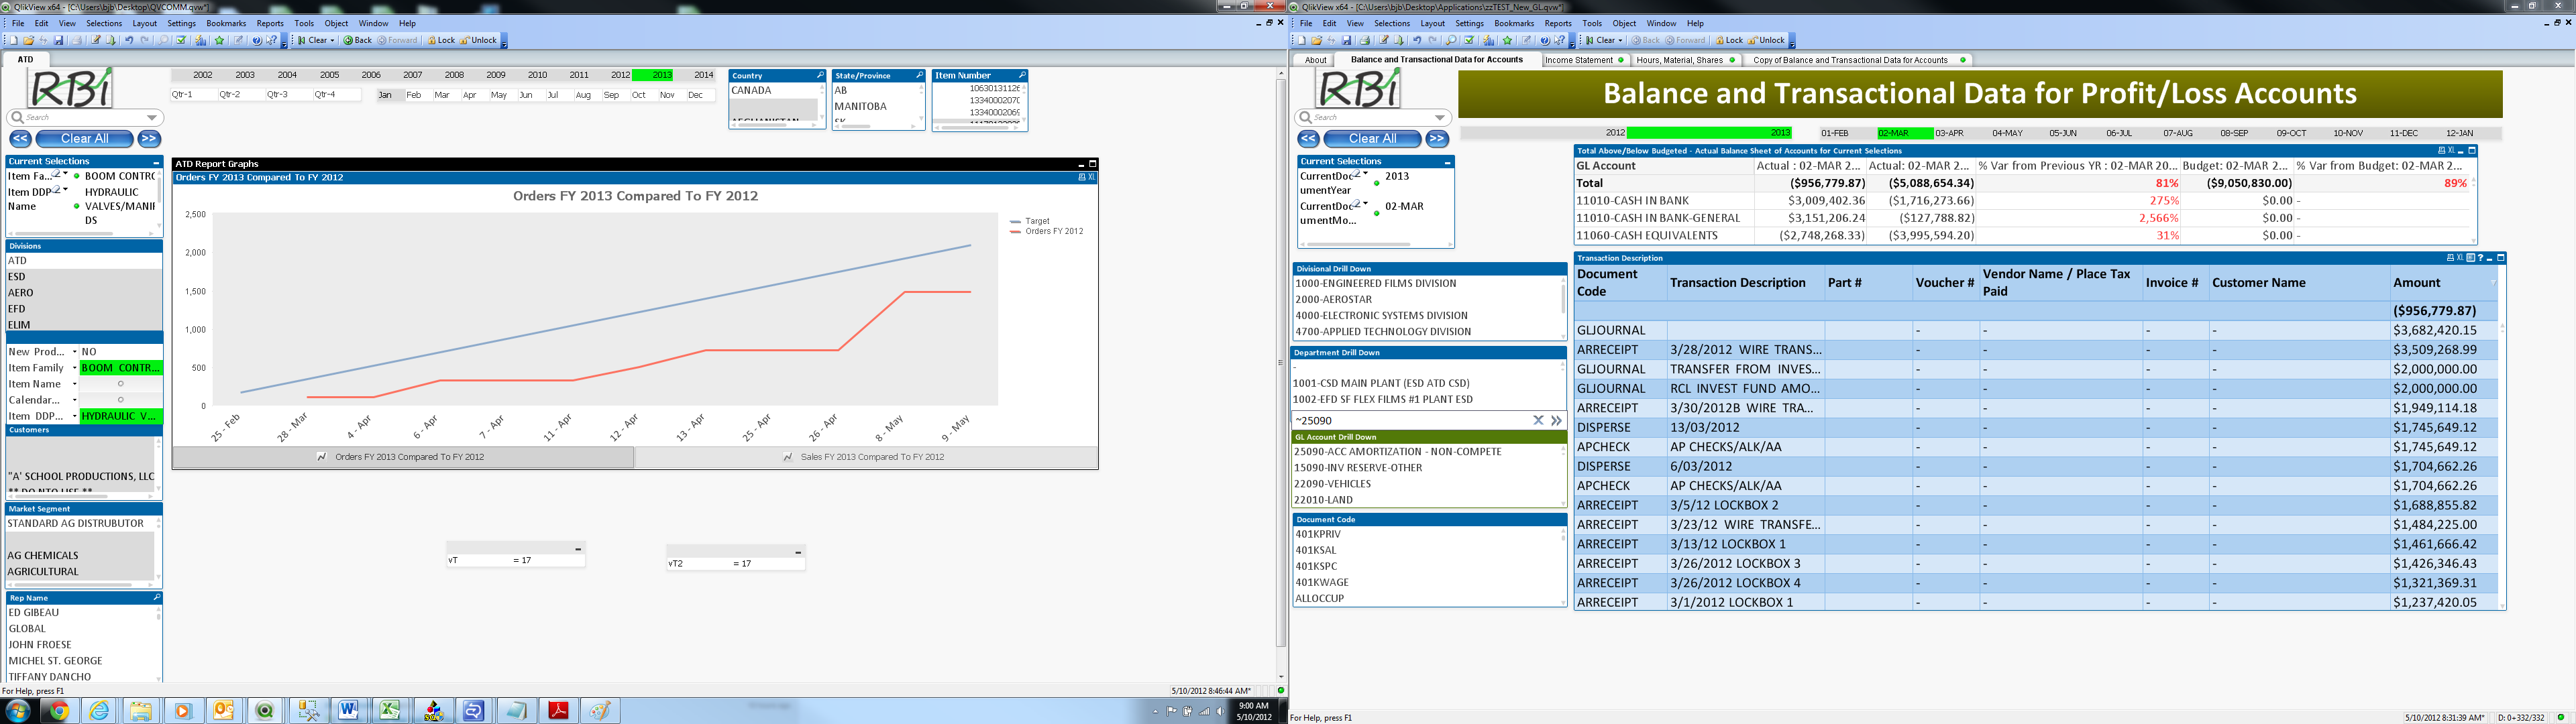
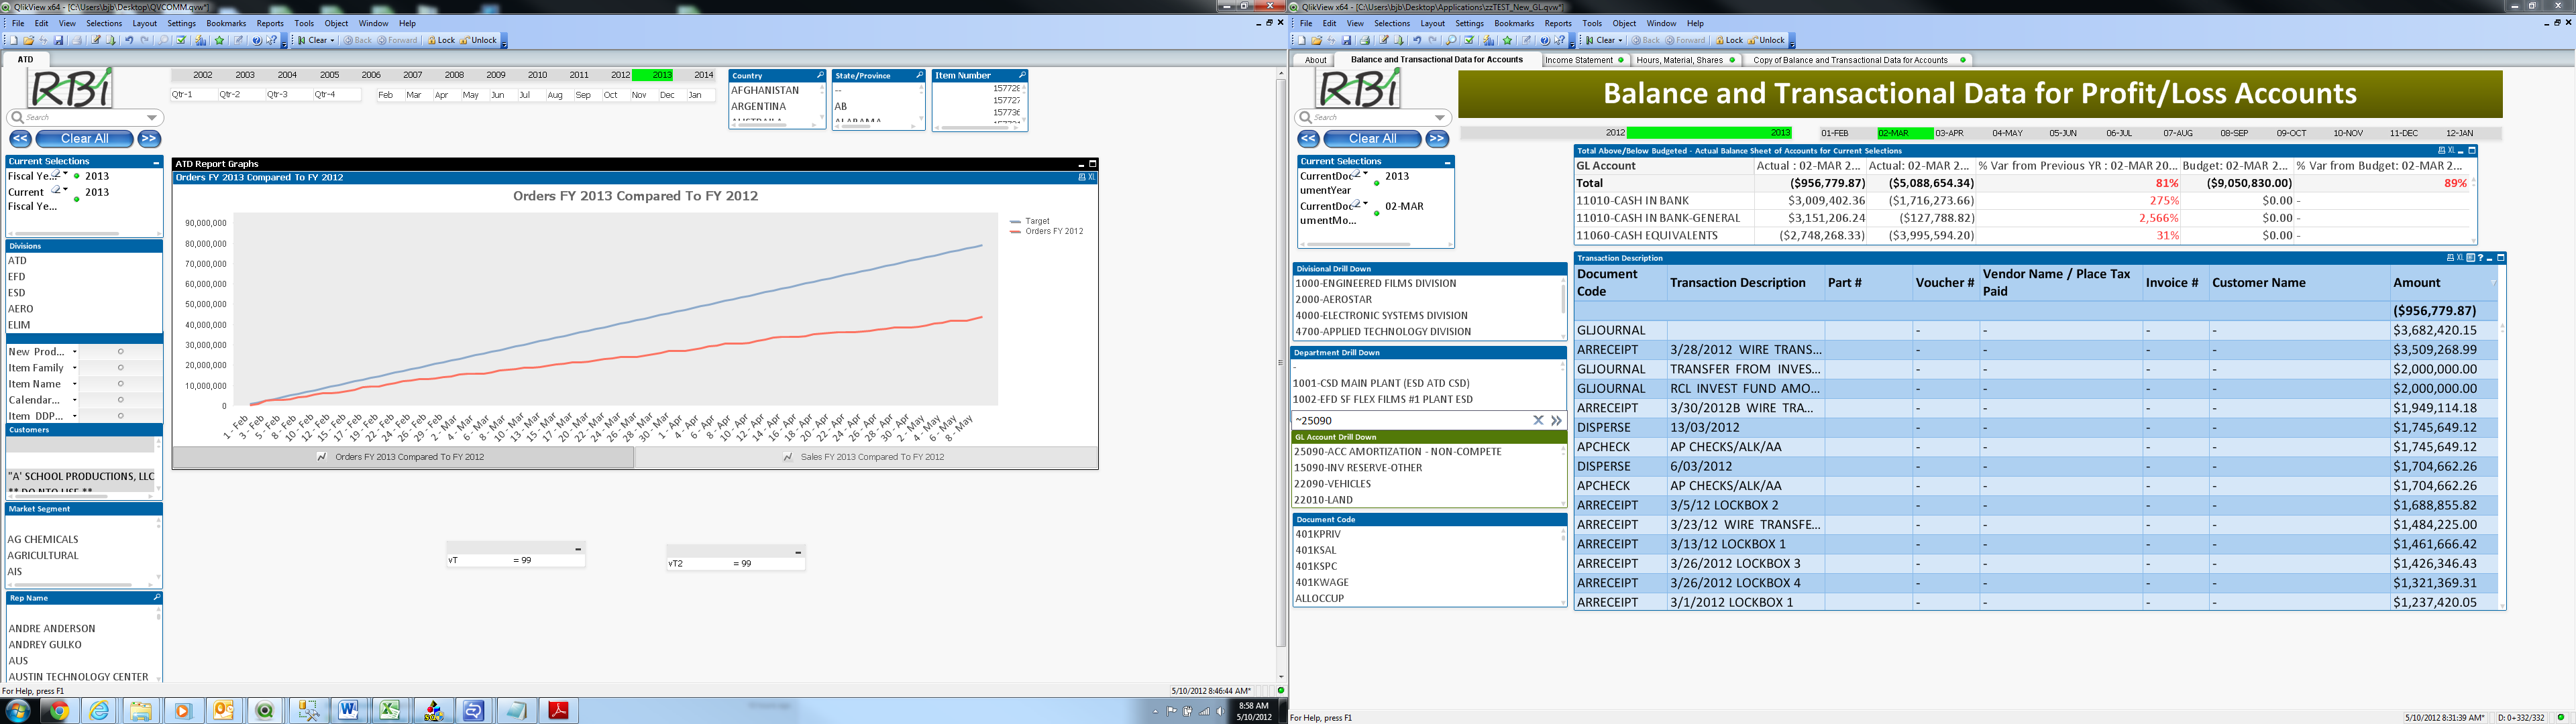
Both graphs show an accumulation of two expressions with a dates dimension. The bottom graph shows the data graphs with no selections. The top one with a few selections.
I created the line on top of the graphs as a target that is twice the bottom line's value at the end of the period accumulated evenly over the period of dates so that it ends at twice the bottom one on the last day.
When I do a few selections like in the top graph it doesn't work because then the number of days drops and the top line or target only accumulates for the number of dates allowed for the selection.