Unlock a world of possibilities! Login now and discover the exclusive benefits awaiting you.
- Qlik Community
- :
- All Forums
- :
- QlikView App Dev
- :
- Challenging Stacked Bar Chart Showing Contribution
- Subscribe to RSS Feed
- Mark Topic as New
- Mark Topic as Read
- Float this Topic for Current User
- Bookmark
- Subscribe
- Mute
- Printer Friendly Page
- Mark as New
- Bookmark
- Subscribe
- Mute
- Subscribe to RSS Feed
- Permalink
- Report Inappropriate Content
Challenging Stacked Bar Chart Showing Contribution
Greetings, Qlikview folks. I have a requirement from a user to show a rather strange stacked bar chart that I'm completely stumped about how to create in Qlikview (the user was able to create it in Excel).
The chart looks like this:
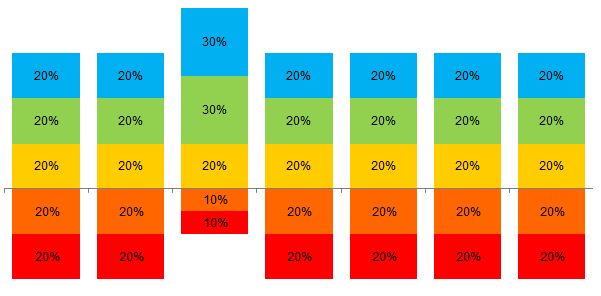
Basically, it's a stacked bar chart that shows the contribution of each answer to a total of 100% (note that each bar is the same height).
On its own this isn't incredibly hard to do; I would use an expression like:
count(Attribute) / count(total <2nd dimension> Attribute)
What's particularly challenging is that they want to move the X axis so that it always lays above the bottom two amounts, as shown in the above image (note that the size of each segment of the bar is proportional to its value.
I've played around with this for several hours and I just can't come up with a way to recreate this in Qlikview. I expect any solution offered will involve multiple expressions.
Anyone want to shoot me some ideas to play around with?
Accepted Solutions
- Mark as New
- Bookmark
- Subscribe
- Mute
- Subscribe to RSS Feed
- Permalink
- Report Inappropriate Content
Hi, I used to chart this type of graphs in the past. Basically the trick was to convert bottom 2 figures to negative numbers. Have you tried that?
- Mark as New
- Bookmark
- Subscribe
- Mute
- Subscribe to RSS Feed
- Permalink
- Report Inappropriate Content
In the Chart properties window, have you looked at setting a static min, using an expression? If you enable the Static Min property, an Ellipsis shows and you can use a formula to set the Min value, or use a static number.
To find this, open the Chart Properties, then on the Axes Tab, look to the top right, inthe Scale box.
Good luck.
Nate
- Mark as New
- Bookmark
- Subscribe
- Mute
- Subscribe to RSS Feed
- Permalink
- Report Inappropriate Content
Hi, I used to chart this type of graphs in the past. Basically the trick was to convert bottom 2 figures to negative numbers. Have you tried that?
- Mark as New
- Bookmark
- Subscribe
- Mute
- Subscribe to RSS Feed
- Permalink
- Report Inappropriate Content
Thanks for the suggestion. I did exactly what you recommended - used a conditional statement in the expression to check the values, and then multiplied the bottom 2 values by -1. The result was exactly what I was looking for. Added a presentation line on the axis to make it look nice and voila!