Unlock a world of possibilities! Login now and discover the exclusive benefits awaiting you.
- Qlik Community
- :
- All Forums
- :
- QlikView App Dev
- :
- Re: Google Maps - locations not showing correctly
- Subscribe to RSS Feed
- Mark Topic as New
- Mark Topic as Read
- Float this Topic for Current User
- Bookmark
- Subscribe
- Mute
- Printer Friendly Page
- Mark as New
- Bookmark
- Subscribe
- Mute
- Subscribe to RSS Feed
- Permalink
- Report Inappropriate Content
Google Maps - locations not showing correctly
Hi, new to CQlikview and trying to get a map up and running, copied a chart object & scripting from an example file and I am able to get the map coming up ok but my locations (London & Amman) are not showing in the correct spots. I have multiple London locations and they show up all over the world (most of them in the ocean at either the top or bottom of the globe. Have checked my geocoding and it is correct. Anything simple I need to adjust?
Roger
- Tags:
- new_to_qlikview
- Mark as New
- Bookmark
- Subscribe
- Mute
- Subscribe to RSS Feed
- Permalink
- Report Inappropriate Content
Maybe the following document can guide you: http://global.qlik.com/uploadedfiles/Whitepapers/whitepaper_how_qliktech_uses_qlikview_google_maps.p...
Just follow all the steps in this document, and it should work correctly.
- Mark as New
- Bookmark
- Subscribe
- Mute
- Subscribe to RSS Feed
- Permalink
- Report Inappropriate Content
Hi,
If you want you could try out Idevio Maps as an alternative to Google Maps, it's a faster, more interactive way to use maps within Qlikview. Main benefits are:
- Fast map with dynamic zoom and pan.
- Client side rendering, handles thousands of objects with ease.
- Plug and play, easy to setup and configure.
- World coverage, street level for many areas.
- Secure, own hosting possible.
IdevioMaps are available to Qlikview 10 and as an extension object.
Visit www.idevio.com for more info and demo (logon on with demo demo).

Idevio is a QlikTech Technology partner since 2009 and our maps are currently featured both at QlikMarket and at QlikDemos. Of course, I would be happy to provide eval licenses anyone should be interested.
Thanks,
Patric patric.nordstrom@idevio.com
- Mark as New
- Bookmark
- Subscribe
- Mute
- Subscribe to RSS Feed
- Permalink
- Report Inappropriate Content
Hi All,
GIS/Maps Analytics in QlikView is a very interesting topic indeed.
However, there are many technical limitations in using Google Maps (GMaps) to display QlikView KPI indicators. First of all, the drill-down, pan and selection capabilities are quite limited. Moreover, you cannot display several indicators at the same time and on the same map (background + foreground indicators), you are also limited to draw bubbles and therefore you cannot display pie/bar charts nor "real" heat maps. Finally, you cannot display QlikView KPIs on specific Sales/Business Areas with GMaps such as the Bricks in the Pharmaceutical sector (Brick = aggregation of zipcodes).
On top of that, there are also a few "commercial" aspects to be considered since many QlikView customers & channel partners use GMaps API "FREE" Key inside their QlikView server or rich client without complying with GMaps license terms...Indeed, for "professional internal use" (intranet, extranet or internet with username/password authentication to QlikView application), you must buy GMaps API "Premier" which costs about 10,000 $ USD per year or 8,500 euros per year + possible extra fees depending upon the total number of daily hits.
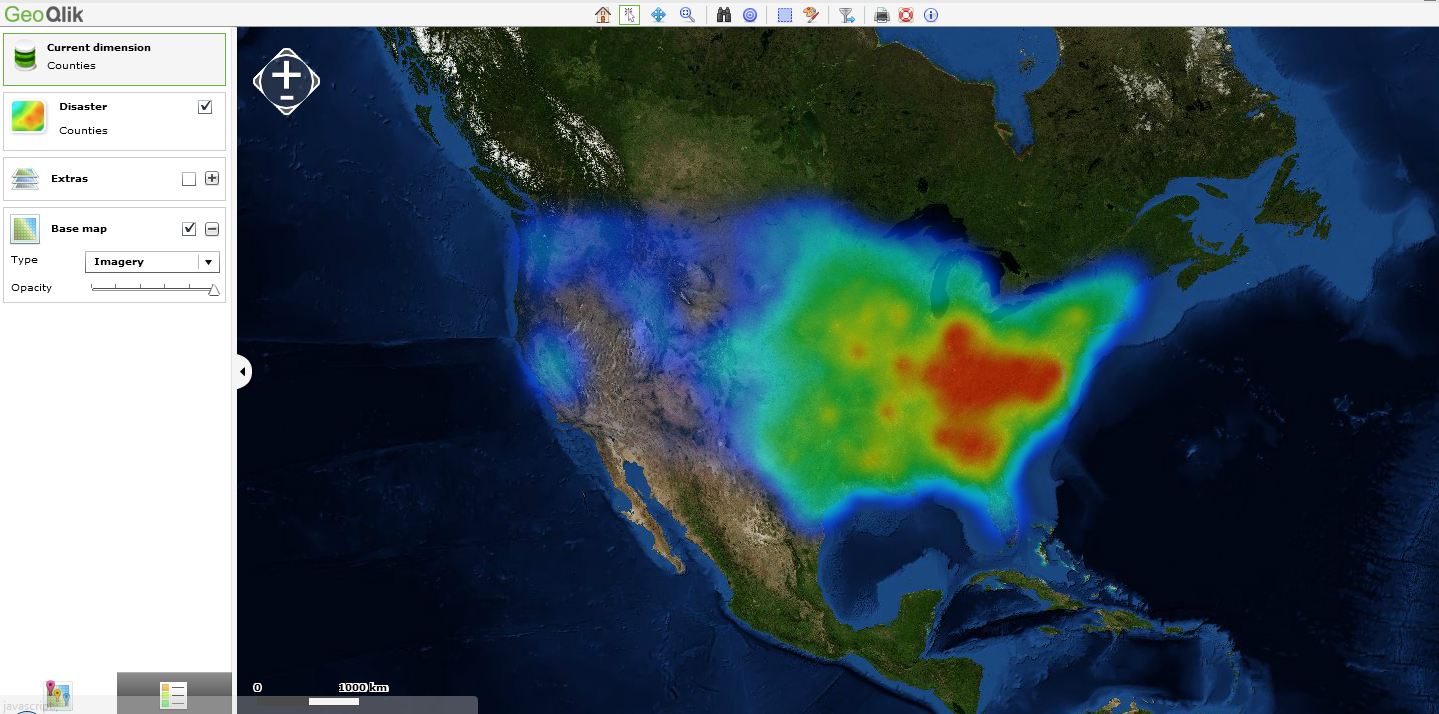
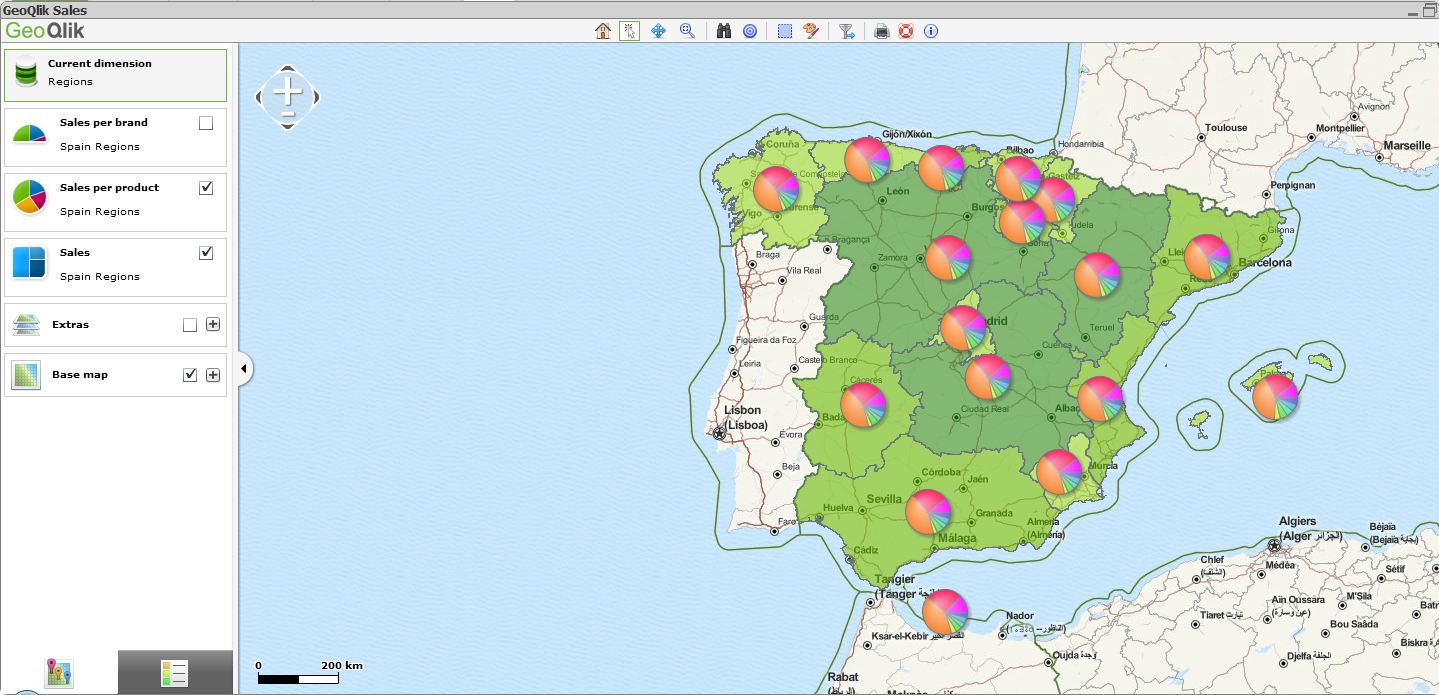
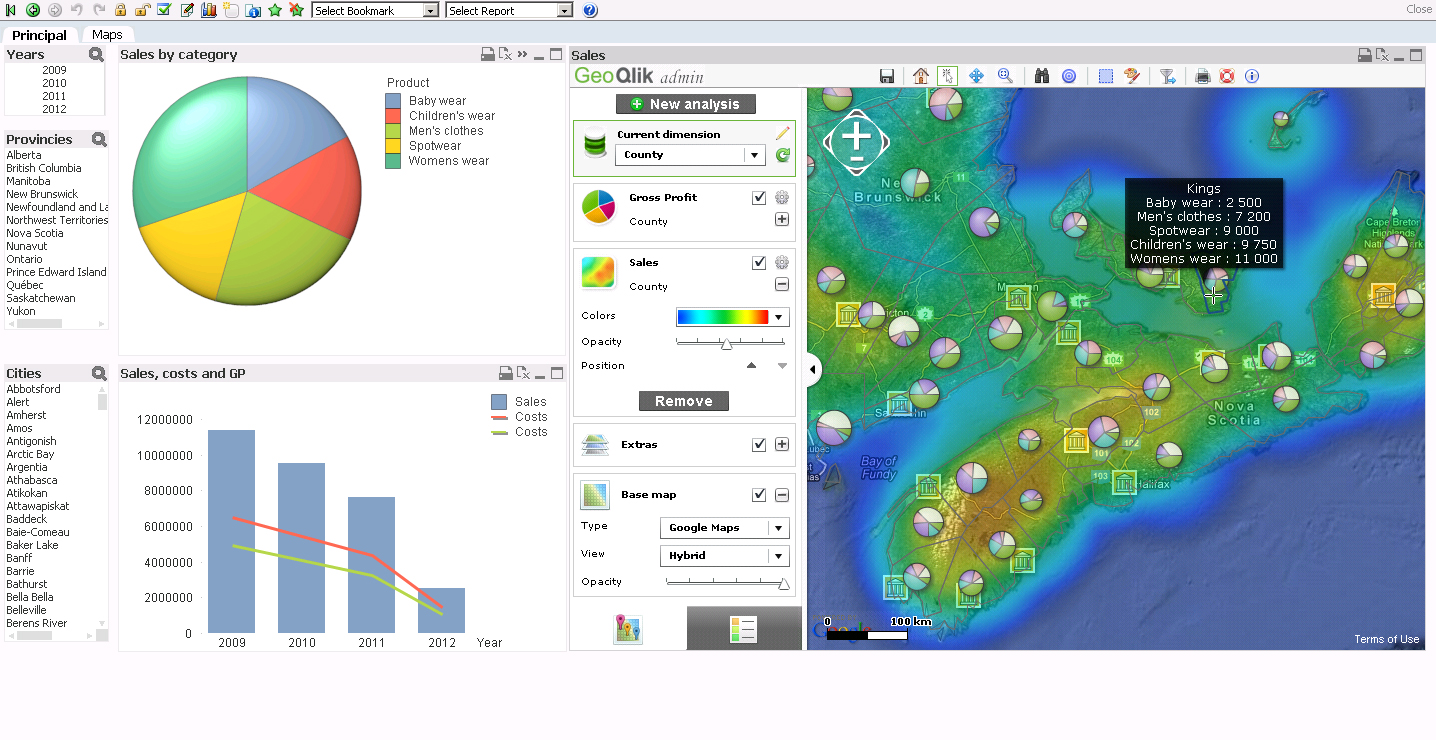
A few alternatives exist such as Open Street Map (totally FREE) or other WMS/TMS services. I hereby suggest you to have a look at our new mapping extension for QlikView 11 SR1 namely "GeoQlik v11.6":
http://www.geoqlik.com/en/geoqlik-for-qlikview/geoqlik-v11.html
Please find hereafter a few screenshots of GeoQlik V11.6 using WMS/TMS services to display QlikView KPIs:

Thanks and best regards,
David
@ Business Geografic