Unlock a world of possibilities! Login now and discover the exclusive benefits awaiting you.
- Qlik Community
- :
- All Forums
- :
- QlikView App Dev
- :
- Re: Need urgent help regarding Cumulative Sum
- Subscribe to RSS Feed
- Mark Topic as New
- Mark Topic as Read
- Float this Topic for Current User
- Bookmark
- Subscribe
- Mute
- Printer Friendly Page
- Mark as New
- Bookmark
- Subscribe
- Mute
- Subscribe to RSS Feed
- Permalink
- Report Inappropriate Content
Need urgent help regarding Cumulative Sum
I have one Bar chart in which I have two dimension :
FIrst Dimension: Month_Year
Second Dimension: Product_Name
And in Expression : rangesum(above( TOTAL sum(Total_Cost), 0, rowno(Total)))
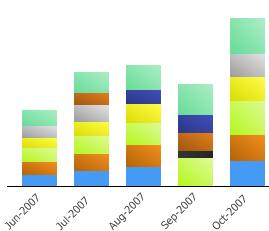
Now is Result I am execpting is that on every next bar the previous bar total should be add. Now if you see the Image the "GREY" color Product has not come in "Aug-2007".
I have set expression to "FULL ACCUMULATION". Dimensions I have check by setting "Suppress When Value is Null" true/false bot. but I Have not able to find the solution.
Kindly grab some time to solve this.
- « Previous Replies
-
- 1
- 2
- Next Replies »
Accepted Solutions
- Mark as New
- Bookmark
- Subscribe
- Mute
- Subscribe to RSS Feed
- Permalink
- Report Inappropriate Content
Hi
Bilge and Qlik_techie,
Thanks for your help.
The solution not exactly solved my problem but was very helpful to understand.
I got the solution, what I did:
First in Script I Laod Distinct Product Name in a non link table Say Product_table2:
in which I have only Products- Product_New.
Now in Chart
In Dimension I used First MonthYear, Second Product_New(Non Linked Table column).
After that in Express I Wrote Sum(If(Product=Product_New, Total_Cost,0))
By using this expression and using Full Accumulation. it gives a desired Result.
Thanks All.
- Mark as New
- Bookmark
- Subscribe
- Mute
- Subscribe to RSS Feed
- Permalink
- Report Inappropriate Content
- Mark as New
- Bookmark
- Subscribe
- Mute
- Subscribe to RSS Feed
- Permalink
- Report Inappropriate Content
Hi,
I'm suspecting that you don't have any value for the "GREY" section for Aug-2007 or Sep-2007.. and I think this will lead to it not showing up for that dimension value (even though Full Accumulation is set). See if you can add a value 0 or something for this section for these dimension values just so that the "GREY" part is actually represented.
- Mark as New
- Bookmark
- Subscribe
- Mute
- Subscribe to RSS Feed
- Permalink
- Report Inappropriate Content
@Bilge : I have Add the QVW file , please find. any help in this regard will be helpful.
@Johannes: Yes you are right there is no value for GREY section. but data is in this manner and I have attached the document. Hope you can suggest some alternate or any set analysis to achieve a right result, which I am expecting.
Thanks
- Mark as New
- Bookmark
- Subscribe
- Mute
- Subscribe to RSS Feed
- Permalink
- Report Inappropriate Content
Hm,
Not sure how much it slows down your script since I suspect this is a subset of data.. but if you rename your inline load to "Table", you could add the following script at the end to populate each Monthyear + Product combo with a 0 value just to make the totals display the way you want in the chart:
T1:
Load distinct
Monthyear,
0 as Cost
Resident Table;
join (T1)
Load distinct
Product
Resident Table;
join (Table)
Load * resident T1;
drop table T1;
Maybe it can be written in a smoother way as well. Also keep in mind that if you do a count of the Product field you will have more rows now, if that makes sense.
- Mark as New
- Bookmark
- Subscribe
- Mute
- Subscribe to RSS Feed
- Permalink
- Report Inappropriate Content
Hello Johannes, I have not tried your solution as problem will not solve like this way. See this is transaction table and can be huge in size. But from your point Its clear that the result will not come till I have blank data in corresponding to that Product. but for your information we dont even have product. Ex: in a particular month we dont have Sale for that product. But in Bar chart on particular month for that Product the cumulative total will remain same as in previous month.
Say:
Sale Month Product cumulative(Bar Graph)
10 Jan A1 10
20 Feb A2 (A1-10, A2-20)
So if in feb month A1 exist or not we need on bar charts it should show. which is hide in my case. and expecting some good alternate suggestion.
- Mark as New
- Bookmark
- Subscribe
- Mute
- Subscribe to RSS Feed
- Permalink
- Report Inappropriate Content
Hi,
I tried my solution in the attached file.
Pls. let me know if it is OK and if you have any questions.
Best regards,
- Mark as New
- Bookmark
- Subscribe
- Mute
- Subscribe to RSS Feed
- Permalink
- Report Inappropriate Content
Hi Bilge,
Thanks for gving time for this problem, I have checked your given solution its look same as I am looking for. But problem is when I put it in Dynamic environment as the data which I send was some subset of data. In Dynamic environment when MonthYear are coming for 5 years then Its getting fail to display the bar chart. Nothing is visible. I am just busy and check once again, then revert back. Might be the issue with MonthYear as in your version it is fixed and one for one year. but in my case I am creating it from Date, and I am also using Master Calender script. However your solution give me idea, i will check and post if succeed.
Question : Is there need to create one vMonthYear with comma separated monthyear, even we have MonthYear.. Can we not use some set analysis to include and exclude something to get the desired result.
Thannks
- Mark as New
- Bookmark
- Subscribe
- Mute
- Subscribe to RSS Feed
- Permalink
- Report Inappropriate Content
Hi,
One thing I forgot to mention, in my script the date format is set as follows, to match your MonthYear format, so that the dates in vMonthYear are ordered.
SET DateFormat='DD-MMM-YYYY';
The purpose of using vMonthYear is to have all the months in the dimension of the chart, regardless of the data. For example some products do not have data for September 2007, if we use MonthYear directly as dimension, then the bar chart does not display a bar for September 2007 for these product.
If you can provide a sample of your qlikview with more data for more than one year, I can have a look.
On the other hand, if your data is very big, using vMonthYear in the dimension might cause performance issues.
Best regards,
http://quickdevtips.blogspot.com/
- Mark as New
- Bookmark
- Subscribe
- Mute
- Subscribe to RSS Feed
- Permalink
- Report Inappropriate Content
hi,
if you can use only Month as dimension instead of Month_Year, then it will be easier to use the following expression.
sum( {$<Month={Jan}>} Total_Cost) as 1st expression, sum( {$<Month={Feb}>} Total_Cost) as 2nd expression,
..........and so on till Dec & do Full Accumulation for these 12 expressions.
You can select the Year from List Box.
Let me know if this works
Regards
- « Previous Replies
-
- 1
- 2
- Next Replies »