Unlock a world of possibilities! Login now and discover the exclusive benefits awaiting you.
- Qlik Community
- :
- All Forums
- :
- QlikView App Dev
- :
- Re: Show chart in the table
- Subscribe to RSS Feed
- Mark Topic as New
- Mark Topic as Read
- Float this Topic for Current User
- Bookmark
- Subscribe
- Mute
- Printer Friendly Page
- Mark as New
- Bookmark
- Subscribe
- Mute
- Subscribe to RSS Feed
- Permalink
- Report Inappropriate Content
Show chart in the table
Goal:
Show chart in the column of the table for each year. I want to show chart in month for for all years.
Problem:
I don't know how to do it?
Accepted Solutions
- Mark as New
- Bookmark
- Subscribe
- Mute
- Subscribe to RSS Feed
- Permalink
- Report Inappropriate Content
see attached.
The key is that you need to choose the correct type of dimension so that the chart looks right.
- Mark as New
- Bookmark
- Subscribe
- Mute
- Subscribe to RSS Feed
- Permalink
- Report Inappropriate Content
I assume you have data for single dates, then you can use QV date and time functions to create e.g. Months:
LOAD
Date,
Value,
Year,
Month(Date) as Month,
MonthName(Date) as Month2
FROM Table;
And then use the Month or Month2 field as dimension (in addition to Year or stand-alone) in your table chart.
- Mark as New
- Bookmark
- Subscribe
- Mute
- Subscribe to RSS Feed
- Permalink
- Report Inappropriate Content
Hi swuehl,
If I understand from your side, your solution can visualize a chart type for instance bar, line funnel chart based on data of month?
- Mark as New
- Bookmark
- Subscribe
- Mute
- Subscribe to RSS Feed
- Permalink
- Report Inappropriate Content
My solution creates additional fields in your data model, namely Month and Month2. You can then use these fields as dimension in a chart to group your data by.
These charts can be of any type that takes a dimension, bar chart, line chart etc.
Not sure if I understand your issue properly, could you post some sample lines of data and your expected outcome?
- Mark as New
- Bookmark
- Subscribe
- Mute
- Subscribe to RSS Feed
- Permalink
- Report Inappropriate Content
I have attached some files in this message.
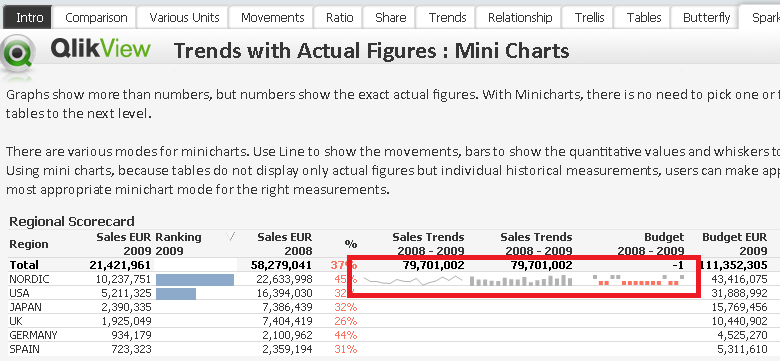
In the table, inside of the qlikview file, I need to add a bar or line chart (display in month) for each row based on year.
Look at the picture..png and its red mark. My request is to get that selected red one in my qlikview application.
- Mark as New
- Bookmark
- Subscribe
- Mute
- Subscribe to RSS Feed
- Permalink
- Report Inappropriate Content
Hi,
Add a new expression in your straight table and in Expressions tab > Display Options>selection representation as "Mini Chart". Click on mini chart properties and you will get the option to select many modes. Here you can select the right dimension and have graph/chart within a straight table chart.
Regards,
Raghav
- Mark as New
- Bookmark
- Subscribe
- Mute
- Subscribe to RSS Feed
- Permalink
- Report Inappropriate Content
Hi,
I have tried many times and I can't achieve the result.
- Mark as New
- Bookmark
- Subscribe
- Mute
- Subscribe to RSS Feed
- Permalink
- Report Inappropriate Content
see attached.
The key is that you need to choose the correct type of dimension so that the chart looks right.