Unlock a world of possibilities! Login now and discover the exclusive benefits awaiting you.
- Qlik Community
- :
- All Forums
- :
- QlikView App Dev
- :
- Re: Labels / Percentage Errors
- Subscribe to RSS Feed
- Mark Topic as New
- Mark Topic as Read
- Float this Topic for Current User
- Bookmark
- Subscribe
- Mute
- Printer Friendly Page
- Mark as New
- Bookmark
- Subscribe
- Mute
- Subscribe to RSS Feed
- Permalink
- Report Inappropriate Content
Labels / Percentage Errors
Hey all,
So basically I've created a the following pie chart with the code within the expressions section (each being a seperate expression)
Good =count({<Q2LastYearScore = {1}, Year = {2011}>} responseid)/ count({<Year = {2011}>} Q2LastYearScore)
Same =count({<Q2LastYearScore = {2}, Year = {2011}>} responseid)/ count({<Year = {2011}>} Q2LastYearScore)
Worse =count({<Q2LastYearScore = {3}, Year = {2011}>} responseid)/ count({<Year = {2011}>} Q2LastYearScore)
and the result i get is :
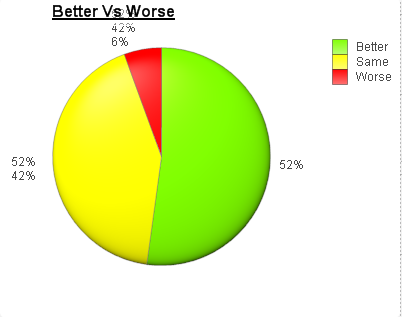
It shows all the percentages for each section, why is this and how can i change it so it only shows the correct percentage for each section?
- Mark as New
- Bookmark
- Subscribe
- Mute
- Subscribe to RSS Feed
- Permalink
- Report Inappropriate Content
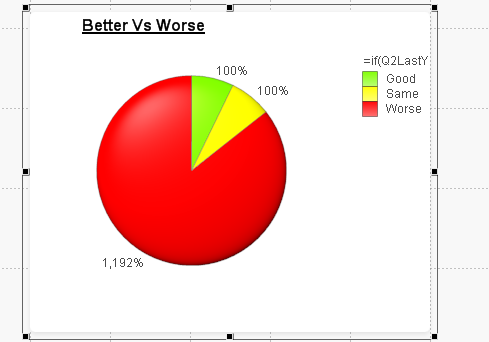
Create a calcuated dimension:
if(Q2LastYearScore=1,'Good',if(Q2LastYearScore=2,'Same','Worse'))
and have the expression as
count({<Year = {2011}>} responseid)/ count({<Year = {2011}>} Q2LastYearScore)
You need to have only one expression.
Regards,
Kiran Rokkam.
- Mark as New
- Bookmark
- Subscribe
- Mute
- Subscribe to RSS Feed
- Permalink
- Report Inappropriate Content
That gives the following which is not right:
- Mark as New
- Bookmark
- Subscribe
- Mute
- Subscribe to RSS Feed
- Permalink
- Report Inappropriate Content
Can you enable "relative" for the expression?
Regards,
Kiran Rokkam.
- Mark as New
- Bookmark
- Subscribe
- Mute
- Subscribe to RSS Feed
- Permalink
- Report Inappropriate Content
once enabled still gives incorrect figures 😕
- Mark as New
- Bookmark
- Subscribe
- Mute
- Subscribe to RSS Feed
- Permalink
- Report Inappropriate Content
jaivik:
Pie chart shows the contribution of each elements wrt the total. I noticed that expression has a denominator and hence the chart doesnt add up to 1. Can you remove the denominator and disable relative expression. If it doenst work please share a sample for debug.
Kiran Rokkam.