Unlock a world of possibilities! Login now and discover the exclusive benefits awaiting you.
- Qlik Community
- :
- All Forums
- :
- QlikView App Dev
- :
- Re: Chart vs. Table box
- Subscribe to RSS Feed
- Mark Topic as New
- Mark Topic as Read
- Float this Topic for Current User
- Bookmark
- Subscribe
- Mute
- Printer Friendly Page
- Mark as New
- Bookmark
- Subscribe
- Mute
- Subscribe to RSS Feed
- Permalink
- Report Inappropriate Content
Chart vs. Table box
Here is a question:
When I create a table box in a page, I can select how the selection will look like, i.e. LED check box, window check box and etc.
With this object, when the user makes a selection, all non-selected values are grayed out but can still be selected with a simple click.
When I create a chart object (straight table for that matter), I don’t have that option. Meaning, if a user makes a selection, all other values are disappeared and he can’t do a multiple selection (unless drag over a range of values).
How can I allow the user to have multiple selections that are not adjacent to one another within a chart object?
- « Previous Replies
-
- 1
- 2
- Next Replies »
- Mark as New
- Bookmark
- Subscribe
- Mute
- Subscribe to RSS Feed
- Permalink
- Report Inappropriate Content
If you enable "Show All Values" on your dimension, and disable "Suppress Zero-Values" / "Suppress Missing" you will still see the deselected values in your Straight Table/Chart.
- Mark as New
- Bookmark
- Subscribe
- Mute
- Subscribe to RSS Feed
- Permalink
- Report Inappropriate Content
hi Johan,
actually thats what i did.
the result is that it shows the selected value / values and all the zero values.
but it doesnt show nonzero non selected values.
any other ideas? because at this point i have no more supressiones to uncheck.....
- Mark as New
- Bookmark
- Subscribe
- Mute
- Subscribe to RSS Feed
- Permalink
- Report Inappropriate Content
oh and also,
it still doesnt allow me to do multi-select.
so maybe im missing somthing here?
- Mark as New
- Bookmark
- Subscribe
- Mute
- Subscribe to RSS Feed
- Permalink
- Report Inappropriate Content
Hi Elanir,
I did not understand, you want to select more value not adjacent from a fild box?
Try to use CTRL and select more elements.
Or you want to see too the elements not selected?
Regards
Luca Jonathan Panetta
- Mark as New
- Bookmark
- Subscribe
- Mute
- Subscribe to RSS Feed
- Permalink
- Report Inappropriate Content
Luca,
its very simple.
in a table box one can select multiple values by selecting a range of values or by using CTRL as you mentioned.
in chart objects (straight table) you can only select multiple values by selecting a range of values.
but you cant select multiple values by using CTRL.
im looking for a solution that will allow me to do that.... any ideas?
- Mark as New
- Bookmark
- Subscribe
- Mute
- Subscribe to RSS Feed
- Permalink
- Report Inappropriate Content
Hi Elanir,
but why can't you use a fild fileter external of the chart (eg. pivot table).
In you sheet you have a filter (eg. Customers) and a chart (eg. Pivot table).
So you can use the external filter to choise your data in this example Customers.
And if you have more filters you can group they in a Group Box, I use this technical to reduce the space of elements in my sheets.
I hope this help you.
Regards
Luca Jonathan Panetta
- Mark as New
- Bookmark
- Subscribe
- Mute
- Subscribe to RSS Feed
- Permalink
- Report Inappropriate Content
Luca,
i also do that many times.
but in this case, the user, if i use your example, has the customer dimension in a table box, and than again this dimension appears in that same sheet in a chart object with same dimension but with different calculations.
the user now want to select a group of customers according to performance, not as a range of values but by selecting specific unique values by using CTRL.
and i dont understand why this cant be doen within a chart.....
- Mark as New
- Bookmark
- Subscribe
- Mute
- Subscribe to RSS Feed
- Permalink
- Report Inappropriate Content
Elanir,
can you add an example QVW of your application or an screenshot?
Regards
Luca Jonathan Panetta
- Mark as New
- Bookmark
- Subscribe
- Mute
- Subscribe to RSS Feed
- Permalink
- Report Inappropriate Content
this is how the dashboard looks like: (without the black marks  )
)
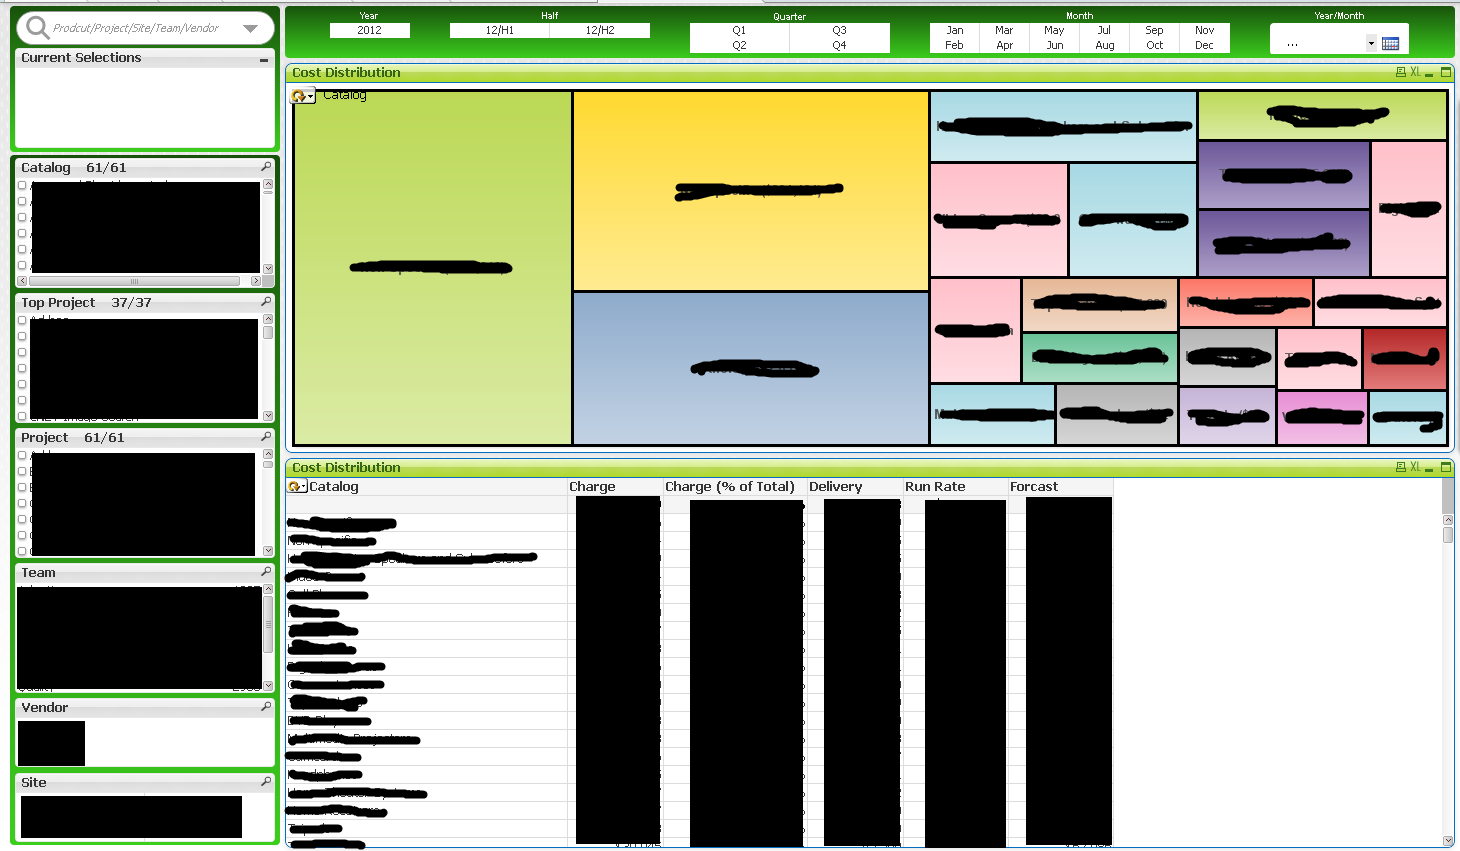
as you can see, i have a table box on the left side to allow selection of multiple values from a dimension.
also in main area, user has that same dimension with all its relevant expressiones.
as i said before, if the user wants to select a number of un-adjacent values from main area by using CTRL, he cant do it.
he can only select a range of adjacent values - not exactly what im looking for.
any ideas?
- « Previous Replies
-
- 1
- 2
- Next Replies »