Unlock a world of possibilities! Login now and discover the exclusive benefits awaiting you.
- Qlik Community
- :
- All Forums
- :
- QlikView App Dev
- :
- Re: Sum hours for a week
- Subscribe to RSS Feed
- Mark Topic as New
- Mark Topic as Read
- Float this Topic for Current User
- Bookmark
- Subscribe
- Mute
- Printer Friendly Page
- Mark as New
- Bookmark
- Subscribe
- Mute
- Subscribe to RSS Feed
- Permalink
- Report Inappropriate Content
Sum hours for a week
How do I set up a bar chart to only sum my 'Timereported' field for a week at a time? Then change when the new week begins.
- « Previous Replies
- Next Replies »
Accepted Solutions
- Mark as New
- Bookmark
- Subscribe
- Mute
- Subscribe to RSS Feed
- Permalink
- Report Inappropriate Content
I do get a bar chart like this:
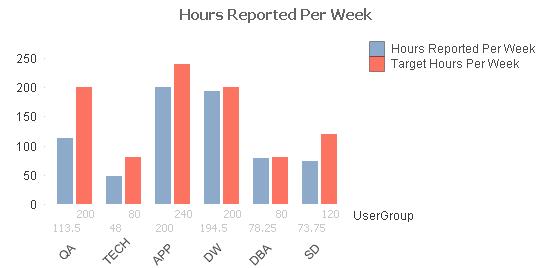
What's wrong with this?
This chart should show the values for last week (Haven't checked in detail).
If you want to get a chart that is insensitive to selections in calendar fields, you might need to clear your calendar fields in the set expression:
=count({<Date = {">=$(=weekstart(today(),-1))<=$(=weekend(today(),-1))"}, Month=, Day=, Year=, Week=, Quarter=>} distinct TechID)*40
- Mark as New
- Bookmark
- Subscribe
- Mute
- Subscribe to RSS Feed
- Permalink
- Report Inappropriate Content
Not sure if I've understood correctly:
a) if you want to group by week, over all weeks, create a week field in your data model. I assume you already have a date field DATE:
LOAD
DATE,
VALUE,
week(DATE) as WEEK // or weekname(DATE) as WEEK
from TABLE;
Then just use sum(VALUE) as expression in a bar chart with dimension WEEK.
b) If you only want to see the current week:
=sum({<DATE = {">=$(=weekstart(today()))<=$(=today())"}>} VALUE)
as expression and no dimension or DATE as dimension (one total bar or a bar per day).
- Mark as New
- Bookmark
- Subscribe
- Mute
- Subscribe to RSS Feed
- Permalink
- Report Inappropriate Content
My current dimension are my groups ('UserGroup') because I'm looking at the amount of hours recorded for each group.
I currently have two dimensions in the bar chart...
sum
(TimeReportedActual)count(distinct(TechID)) * 40
I'm using the first one to sum up the time reported and then using the second one to calculate (based on the number of people in each group) how many hours should ACTUALLY be recoreded each week (based on each person doing a 40 hour work week) so that way both bars for each group should be equal every week if each group is putting in all their time.
I did go and create the week variable with 'week(DATE) as week'. So I need a way for the first equation to show only the current weeks hours that were recorded.
I hope this helps describe what I'm looking to do.
- Mark as New
- Bookmark
- Subscribe
- Mute
- Subscribe to RSS Feed
- Permalink
- Report Inappropriate Content
Also, I want this to always stay with the current week and only for the total hours/reported hours like I said above, regardless of what the users picks, ie the 3rd quarter or the month of June. It would still display information about the current week.
I tried to use that equation above
=sum({<DATE = {">=$(=weekstart(today()))<=$(=today())"}>} VALUE)
But it shows everything from Date onward as a field (its shown in red).
- Mark as New
- Bookmark
- Subscribe
- Mute
- Subscribe to RSS Feed
- Permalink
- Report Inappropriate Content
I'm sorry I misspoke. I want it to only show the previous week.
- Mark as New
- Bookmark
- Subscribe
- Mute
- Subscribe to RSS Feed
- Permalink
- Report Inappropriate Content
Could you explain further? You always have the right answers!
I think I'm just using that equation wrong somehow.
- Mark as New
- Bookmark
- Subscribe
- Mute
- Subscribe to RSS Feed
- Permalink
- Report Inappropriate Content
It might be a problem with date formatting. Could you upload a small sample file?
In general, your bar chart expressions should look like
=sum({<Date = {">=$(=weekstart(today(),-1))<=$(=weekend(today(),-1))"}>} TimeReportedActual)
resp.
=count({<Date = {">=$(=weekstart(today(),-1))<=$(=weekend(today(),-1))"}>} distinct TechID)*40
where Date is the name of your Date field, with Date format being your standard date format.
- Mark as New
- Bookmark
- Subscribe
- Mute
- Subscribe to RSS Feed
- Permalink
- Report Inappropriate Content
I attached the qvw. The Dashboard is what has the bar graph.
If it could, I want a bar graph to show last weeks hours and then another to show the current weeks hours.
- Mark as New
- Bookmark
- Subscribe
- Mute
- Subscribe to RSS Feed
- Permalink
- Report Inappropriate Content
I do get a bar chart like this:
What's wrong with this?
This chart should show the values for last week (Haven't checked in detail).
If you want to get a chart that is insensitive to selections in calendar fields, you might need to clear your calendar fields in the set expression:
=count({<Date = {">=$(=weekstart(today(),-1))<=$(=weekend(today(),-1))"}, Month=, Day=, Year=, Week=, Quarter=>} distinct TechID)*40
- Mark as New
- Bookmark
- Subscribe
- Mute
- Subscribe to RSS Feed
- Permalink
- Report Inappropriate Content
I get that as well. I guess the numbers there are right. Is there a way to make it show last weeks numbers regardless of the user selections?
- « Previous Replies
- Next Replies »