Unlock a world of possibilities! Login now and discover the exclusive benefits awaiting you.
- Qlik Community
- :
- All Forums
- :
- QlikView App Dev
- :
- Re: Expressions with different accumulation period...
- Subscribe to RSS Feed
- Mark Topic as New
- Mark Topic as Read
- Float this Topic for Current User
- Bookmark
- Subscribe
- Mute
- Printer Friendly Page
- Mark as New
- Bookmark
- Subscribe
- Mute
- Subscribe to RSS Feed
- Permalink
- Report Inappropriate Content
Expressions with different accumulation periods
Hello everyone,
I'm pretty new to Qlikview development but I will try to describe my problem as clearly as possible. Basically what I want to do is to create an expression which uses different accumulation periods. I guess I will have to use Set Analysis of some sort.
I have a bunch of transactions with different amounts occurring at different dates. Each transaction is linked to a year, month, and period of that month.
A simplified version of the data can be seen below:
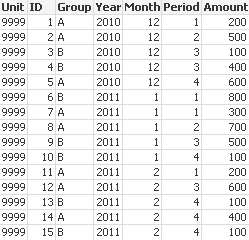
The real data is of course more complicated with more units, groups etc. but I believe that the above table is sufficient to understand my problem.
What I want to do now is to create a table as the one below (but with a different expression):
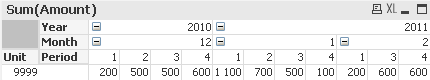
Right now the expression shows Sum(Amount). However what I would like the table to show is the sum(Amount) of group A for all previous periods in the given month divided by the sum(Amount) of group B for the previous month. For example:
Example 1: Column for Year 2011, Month 1, Period 3: Should sum the amount for period 1, 2 and 3 in month 1 for group A. Then divide this with the sum of the amounts for group B in month 12 of 2010 (all periods).
Example 2: Column for Year 2011, Month 2, Period 1: Should sum the amount for period 1 month 2 for group A. Then divide this with the sum of the amounts for group B in month 1 (all periods).
I hope this explanation makes sense. I will attach a qvw file with the data loaded.
I will appreciate any help.
Best Regards
- Mark as New
- Bookmark
- Subscribe
- Mute
- Subscribe to RSS Feed
- Permalink
- Report Inappropriate Content
Hi,
since your chart has Year/Month/Period as Dimensions, Set Analysis can only be used for selecting the groups A or B, but not for selecting the "Current Month" or Previous Month, because Set Analysis Condition is only calculated once for the whole chart and not for each cell.
What you need to implement here is what I call the "As of Date" logic. It's a bit complicated and not too easy to explain, but I'll try to describe the basic steps:
1. You need to create a second set of Year/Month/Period (I'll call them "display year, month, period"), in addition to your existing fields (I'll call them "Transaction year, month, period").
2. You need to associate each combination of the three Display fields with the three Transaction fields and create flags to signify "Current Month", "Current Period", "Prior Month", "Prior Period". Each flag can get one of two values - 1 or null(), based on the corresponding condition.
3. For the chart dimensions, use the "Display fields" and not the Transaction Fields.
4. In Set Analysis, use the corresponding flags to filter "Current Month", "Previous Month" etc... When you specify the condition CurrentMonthFlag={1}, only those Transaction Periods that are flagged with 1 for the corresponding Display Period that's being used as a Chart Dimension. Using QlikView association logic, only the relevant data gets aggregated.
I will be teaching this and many other advanced techniques in my upcoming class that should be available on-line in September. Stay tuned if you are interested.
best,
Oleg
- Mark as New
- Bookmark
- Subscribe
- Mute
- Subscribe to RSS Feed
- Permalink
- Report Inappropriate Content
Thank you Oleg for your response. Very appreciated!
I've tried to understand your answer but I can't really seem to wrap my head around the solution.
If I understand correctly I'm supposed to create additional fields something like this:
| Disp_Year | Disp_Month | Disp_Period | Cur_Month | Cur_Per | Pri_Month | Pri_Period |
| 2010 | 12 | 1 | ||||
| 2010 | 12 | 2 | ||||
| 2010 | 12 | 3 | ||||
| 2010 | 12 | 4 | ||||
| 2011 | 1 | 1 | ||||
| 2011 | 1 | 2 | ||||
| 2011 | 1 | 3 | ||||
| 2011 | 1 | 4 | ||||
| 2011 | 2 | 1 | ||||
| 2011 | 2 | 2 | ||||
| 2011 | 2 | 3 | ||||
| 2011 | 2 | 4 |
My first question regarding this is then whether this should be a separate table from the other one or if each row in the other table should have these fields as well.
Second question is then whether each row should in this new table should be linked to the corresponding transaction field; e.g. Trans_year-month-period 2011-01-2 should be in the same row or linked to Display_year-month_period 2011-01-2.
Then if I use the fields Cur_Month, Cur_Per etc. based on when loading the data, it seems to me as if the analysis is very static in the sense that I will only be able to compare the current month with the previous. My dream scenario is of course that I would be able to see the calculation historically. Please correct me if I have misunderstood this.
Maybe if this solution is to complicated (for me 😃 ) I would appreciate any help in any other ways that this could be achieved. To give an understanding of the context of the problem; The reason for the expression is that we would want to calculate the "Invoicing degree" of each unit in each period of the month. We would like to sum the hours worked in the previous month and then see a percentage of how much of this has been invoiced in the periods of the next month (hopefully reaching close to 100 % in period 3 or 4). So in this case, Group A is really "Invoiced Hours" and Group B is "Worked Hours":
I've though that another solution might have to do with parallel states of some sort. One solution that would not be very elegant but could be enough in the meantime is being able to manually select the Group B Year and Month as one parallel state, and then manually select Group A Year and Month (manually choosing this as one month ahead) as another state and then calculating the percentage for each period. I've tried around with this but I can't get it to work either.
Thank you!