Unlock a world of possibilities! Login now and discover the exclusive benefits awaiting you.
- Qlik Community
- :
- All Forums
- :
- QlikView App Dev
- :
- Re: Pivot table calculations
- Subscribe to RSS Feed
- Mark Topic as New
- Mark Topic as Read
- Float this Topic for Current User
- Bookmark
- Subscribe
- Mute
- Printer Friendly Page
- Mark as New
- Bookmark
- Subscribe
- Mute
- Subscribe to RSS Feed
- Permalink
- Report Inappropriate Content
Pivot table calculations
Hello,
I want to change the color of cells in the pivot table below (example) if the value exceeds the value of the previous year.
I tried the use of aggr, above, column etc, but I can not find the right formula.
Can anybody help with this?
| Year | 2009 | 2009 | 2010 | 2010 | ||
| Category | Color | Label | excl | incl | excl | incl |
| bike | blue | 12 | 15 | 13 | 16 | |
| bike | orange | 14 | 17 | 14 | 17 | |
| bike | red | 13 | 16 | 13 | 16 | |
| car | blue | 45 | 50 | 50 | 55 | |
| car | orange | 30 | 35 | 32 | 35 | |
| car | red | 50 | 55 | 50 | 55 |
regards, Meike
Accepted Solutions
- Mark as New
- Bookmark
- Subscribe
- Mute
- Subscribe to RSS Feed
- Permalink
- Report Inappropriate Content
Try with this expression(as Background color expression)
=If(Before(TOTAL Sum(Costs), 2) < Sum(Costs),RGB(255,0,0))
Hope it helps
- Mark as New
- Bookmark
- Subscribe
- Mute
- Subscribe to RSS Feed
- Permalink
- Report Inappropriate Content
Hi,
In expression, Click '+' sign , in background color use like this
=if(Column(1) - Column(3) > 0, blue(), Green())
or
=if(Column(1) - Column(2) > 0, blue(), Green())
i'm not sure of that column number, how many expression you're using. and what are the dimension?
Can you say in detail, or sample post?
Hope it helps
Please close the thread by marking correct answer & give likes if you like the post.
- Mark as New
- Bookmark
- Subscribe
- Mute
- Subscribe to RSS Feed
- Permalink
- Report Inappropriate Content
Thanks for your reply.
Herby I added the example.
I dont think formula will work.
- Mark as New
- Bookmark
- Subscribe
- Mute
- Subscribe to RSS Feed
- Permalink
- Report Inappropriate Content
Try with this expression(as Background color expression)
=If(Before(TOTAL Sum(Costs), 2) < Sum(Costs),RGB(255,0,0))
Hope it helps
- Mark as New
- Bookmark
- Subscribe
- Mute
- Subscribe to RSS Feed
- Permalink
- Report Inappropriate Content
Hi
If the Year is a pivoted dimension, then
=If(Before(Column(1)) > Column(1), red(), green())
Its possible that Column(1) wont work, then use
=If(Before(expr) > expr, red(), green())
Where expr is the chart expression
Hope that helps
Jonathan
- Mark as New
- Bookmark
- Subscribe
- Mute
- Subscribe to RSS Feed
- Permalink
- Report Inappropriate Content
Thanks it work!
- Mark as New
- Bookmark
- Subscribe
- Mute
- Subscribe to RSS Feed
- Permalink
- Report Inappropriate Content
Hello,
can someone tell me if a PivotTable is possible make calculations per row?
eg:
row 1: sum(F1)
row 2: max(F1)
row 3: avg(F1)
row 4: Sum(row 1 + row 2)
- Mark as New
- Bookmark
- Subscribe
- Mute
- Subscribe to RSS Feed
- Permalink
- Report Inappropriate Content
Ya you can do it
with RowNo() function
Pick(RowNo(), Sum(F1),Max(F1),Avg(F1),RangeSum(Sum(F1),Max(F1)))
Hope it helps
Celambarasan
- Mark as New
- Bookmark
- Subscribe
- Mute
- Subscribe to RSS Feed
- Permalink
- Report Inappropriate Content
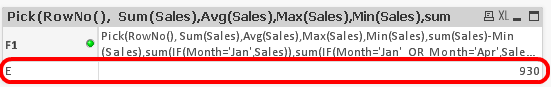
But if I select a row in the pivot table it shows me always the first row value.
- Mark as New
- Bookmark
- Subscribe
- Mute
- Subscribe to RSS Feed
- Permalink
- Report Inappropriate Content
Thanks for the help.
Have you found a way to do this.
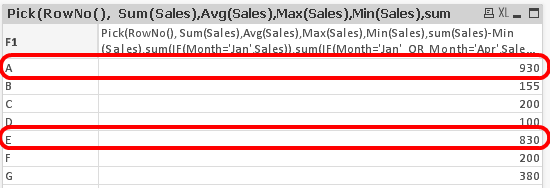
example: Pick (RowNumber, Sum (Sales), Avg (Sales), Max (Sales), Min (Sales), sum (Sales)-Min (Sales))