Unlock a world of possibilities! Login now and discover the exclusive benefits awaiting you.
- Qlik Community
- :
- All Forums
- :
- QlikView App Dev
- :
- Re: accumulation in a diagram
- Subscribe to RSS Feed
- Mark Topic as New
- Mark Topic as Read
- Float this Topic for Current User
- Bookmark
- Subscribe
- Mute
- Printer Friendly Page
- Mark as New
- Bookmark
- Subscribe
- Mute
- Subscribe to RSS Feed
- Permalink
- Report Inappropriate Content
accumulation in a diagram
Hi,
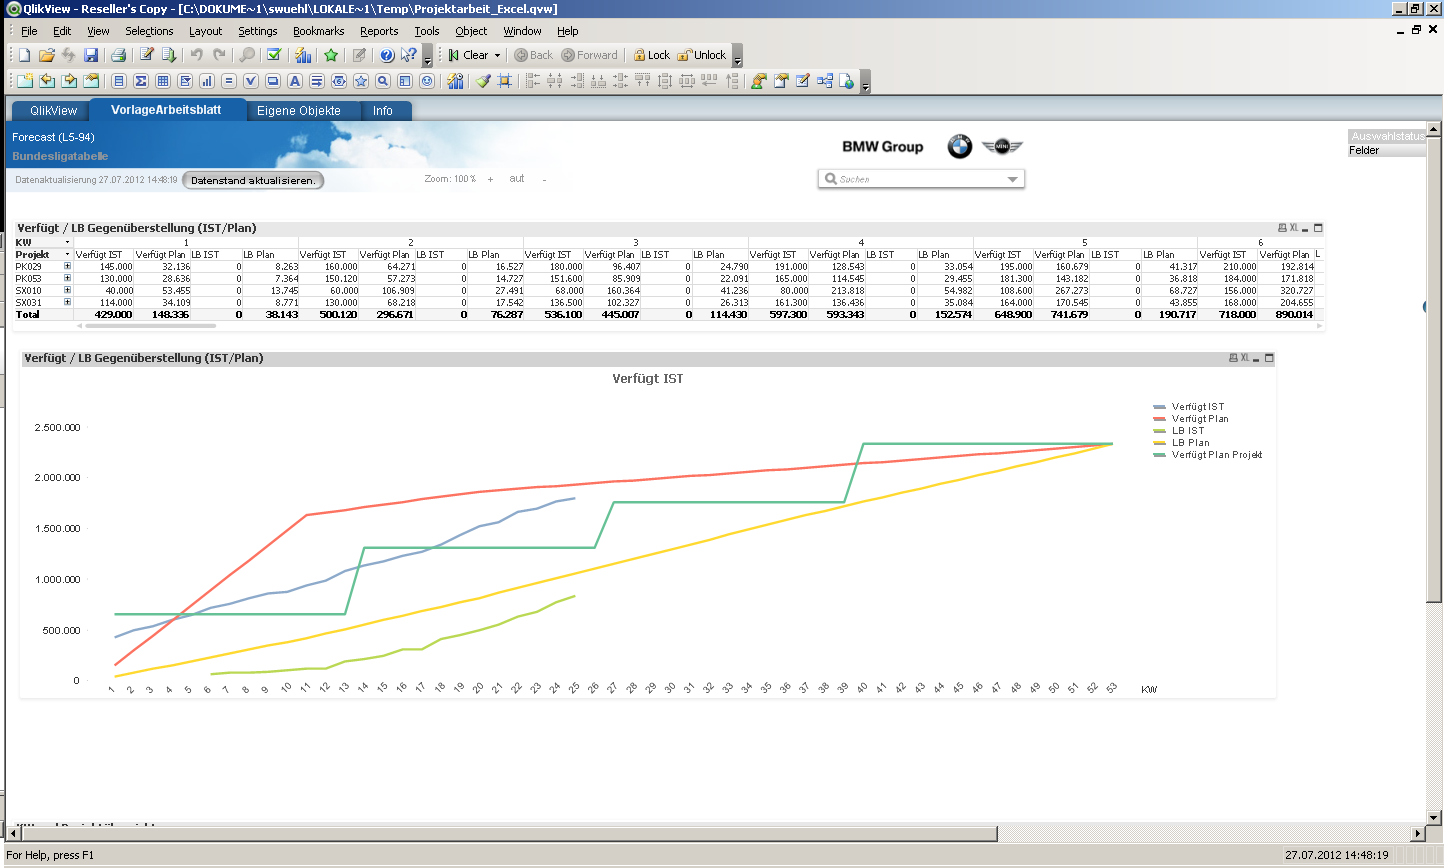
I have different values for each week and want to accumulate them. I tried it with the accumulation button and with the formula
=
rangesum(sum(VerfügtMore), above([Verfügt IST]))I get the same result by both (picture the blue and the light green line)
Is it possible, that the line isn't over the whole x-Axis? only there, where I have accolulated values?
so that they ends at the value 25?
thanks
- « Previous Replies
-
- 1
- 2
- Next Replies »
- Mark as New
- Bookmark
- Subscribe
- Mute
- Subscribe to RSS Feed
- Permalink
- Report Inappropriate Content
Not sure if I've understood.
What do you mean with 'where I have accumulated values'? Do you mean something like where sum(VerfügtMore) is above zero?
Try maybe something like
=if( sum(VerfügtMore) <>0, rangesum(sum(VerfügtMore), above([Verfügt IST])), NULL())
or
=if( WeekField <=25, rangesum(sum(VerfügtMore), above([Verfügt IST])), NULL())
- Mark as New
- Bookmark
- Subscribe
- Mute
- Subscribe to RSS Feed
- Permalink
- Report Inappropriate Content
Yes, the graph is correct now, but I have to change the week every week than.
So that I have to change the 25 to 26 next week and so on. Or is it possible to avoid that somehow?
- Mark as New
- Bookmark
- Subscribe
- Mute
- Subscribe to RSS Feed
- Permalink
- Report Inappropriate Content
Potentially yes, but I can't tell how you determine that your graph should stop at week 25 only only looking at your image. You need to tell us your criterium to show / not show the accumulated values.
For example, if week number should be limited by today's week, use week(today()) as limit in your condition instead of the magic number 25. If it should be limited by looking at the presence of some other field value, do so.
- Mark as New
- Bookmark
- Subscribe
- Mute
- Subscribe to RSS Feed
- Permalink
- Report Inappropriate Content
so the whole background:
the Original file is the Forecast attached (I haven't done it) and there is the formula only sum([Verfügt (EUR)]), that's my VerfügtMore and the line is correct it is only there, where it should be, so there where we have values (at the moment from week 1 to 25) but if I do it in my file Projektarbeit_Excel it display wrong, it doesn't accomulate the datas from the weeks.
So I tried the two solutions I already mentioned, but the line should look like that one from Forecast 
thanks for your help !!
- Mark as New
- Bookmark
- Subscribe
- Mute
- Subscribe to RSS Feed
- Permalink
- Report Inappropriate Content
Not sure if I understand, if I open your Projektarbeit_excel.qvw file, the Verfügt Ist stops at week 25, so I don't see any issue here (and it seems to me that it does accumulate, but the accumulation is part of the data itself, right?):
- Mark as New
- Bookmark
- Subscribe
- Mute
- Subscribe to RSS Feed
- Permalink
- Report Inappropriate Content
the blue line ends at 25 because I take the if instruction, you saies 
and yes, it should accomulate the datas itself for example week 2 = value week 1 + value week 2
- Mark as New
- Bookmark
- Subscribe
- Mute
- Subscribe to RSS Feed
- Permalink
- Report Inappropriate Content
That's not what I see, I see as expression for the blue line (Verfügt IST):
=sum([Verfügt (EUR)])
- Mark as New
- Bookmark
- Subscribe
- Mute
- Subscribe to RSS Feed
- Permalink
- Report Inappropriate Content
in the Forecast file yes, and that's what I don't understand, because if I make =sum([VerfügtMore]) it's a whole line up to week 53 and not up to 25
- Mark as New
- Bookmark
- Subscribe
- Mute
- Subscribe to RSS Feed
- Permalink
- Report Inappropriate Content
No, I was talking about your Projektarbeit_excel.qvw file.
But anyway, I see the same expression in both qvw files and no field called [VerfügtMore].
Sorry, this is too confusing for me, I am giving up on this.
One last thing I noticed: Your data model is fundamentally different from the Forecast model, since you've (probably unintentionally) created a synthetic key table.
This might cause issues (which I still can't see, as said).
Have a nice day,
Stefan
- « Previous Replies
-
- 1
- 2
- Next Replies »