Unlock a world of possibilities! Login now and discover the exclusive benefits awaiting you.
- Qlik Community
- :
- All Forums
- :
- QlikView App Dev
- :
- Re: How to display two values behind themself
- Subscribe to RSS Feed
- Mark Topic as New
- Mark Topic as Read
- Float this Topic for Current User
- Bookmark
- Subscribe
- Mute
- Printer Friendly Page
- Mark as New
- Bookmark
- Subscribe
- Mute
- Subscribe to RSS Feed
- Permalink
- Report Inappropriate Content
How to display two values behind themself
Hi, I would like to ask you for help.
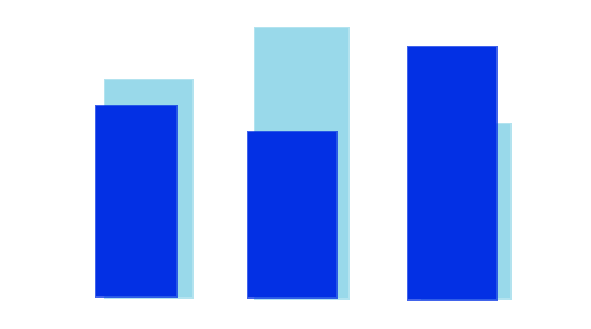
I have two expression values - "Objectives" and "Sales" and "Month"as a dimension. I would like to have "Objectives" behind "Sales".
To choose "stacked" option is wrong because the values are then numbered. 3D view is possible only with dimensions as I know and tried.
Here is example:
Thank you so much for help!
Mirek
Accepted Solutions
- Mark as New
- Bookmark
- Subscribe
- Mute
- Subscribe to RSS Feed
- Permalink
- Report Inappropriate Content
Slightly changed the dataset
- Mark as New
- Bookmark
- Subscribe
- Mute
- Subscribe to RSS Feed
- Permalink
- Report Inappropriate Content
Choose Bar Chart in "General". Add your 2 Dimensions. Under "Style" choose the one that looks like you want (it's the left column right at the bottom on QV 10 under the "Look")
That should get you what you want
- Mark as New
- Bookmark
- Subscribe
- Mute
- Subscribe to RSS Feed
- Permalink
- Report Inappropriate Content
Hi, thank you for answer, but I dont understand which dimension should I add. 3D is possible only with more dimensions than one. Should I put second expression to dimensions?
I just created QVW for show, thank you!
- Mark as New
- Bookmark
- Subscribe
- Mute
- Subscribe to RSS Feed
- Permalink
- Report Inappropriate Content
if these are two different expressions...
i would suggest you can try to fake it..
by overlaying another chart with transaparent background..
have one expression in each chart with the same dimension...
adjust the position of the two charts in such a way that you get your desired effect..
- Mark as New
- Bookmark
- Subscribe
- Mute
- Subscribe to RSS Feed
- Permalink
- Report Inappropriate Content
check attached doc..
- Mark as New
- Bookmark
- Subscribe
- Mute
- Subscribe to RSS Feed
- Permalink
- Report Inappropriate Content
Thank you for fine advice 🙂 I just tried it and it somehow work. But I know that proper way does exist to do it, may be somebody will know 🙂
Thank you anyway!
- Mark as New
- Bookmark
- Subscribe
- Mute
- Subscribe to RSS Feed
- Permalink
- Report Inappropriate Content
Slightly changed the dataset
- Mark as New
- Bookmark
- Subscribe
- Mute
- Subscribe to RSS Feed
- Permalink
- Report Inappropriate Content
Thank yoooou so much!