Unlock a world of possibilities! Login now and discover the exclusive benefits awaiting you.
- Qlik Community
- :
- All Forums
- :
- QlikView App Dev
- :
- Chart: Problem with Total (sum) in Expression
- Subscribe to RSS Feed
- Mark Topic as New
- Mark Topic as Read
- Float this Topic for Current User
- Bookmark
- Subscribe
- Mute
- Printer Friendly Page
- Mark as New
- Bookmark
- Subscribe
- Mute
- Subscribe to RSS Feed
- Permalink
- Report Inappropriate Content
Chart: Problem with Total (sum) in Expression
Hello everyone,
I have a chart that looks like this one:
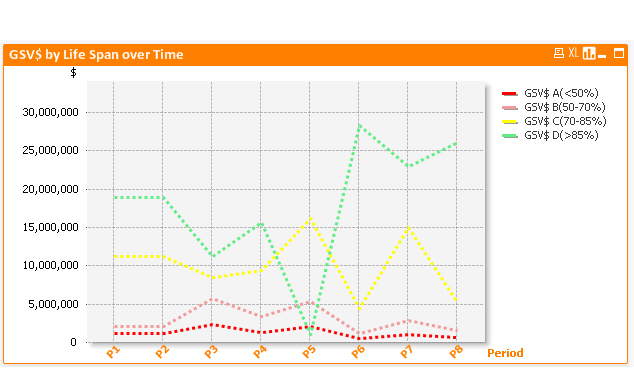
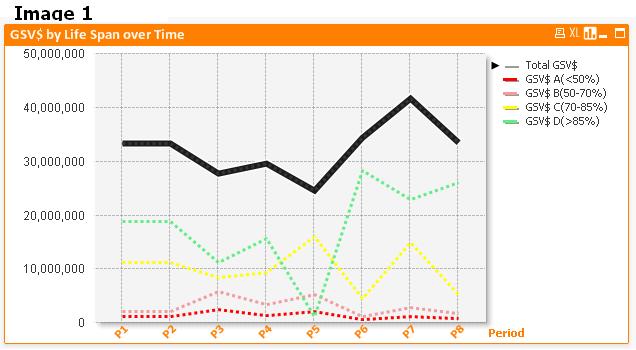
I would like to have another chart line displaying the total of all current lines, to achieve this:
However when i try to add a new expression with the total using this Set Analysis
SUM({$ <Life = {"*"} >} ExtGSV$)
It seems it removes the other 4 lines and i am left with this result, only total is displayed:
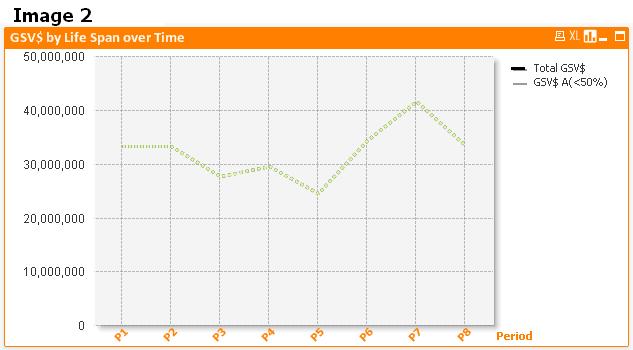
Please help me, i have attached an example to better understand.
thanks a lot in advance for your attention and help.
- Mark as New
- Bookmark
- Subscribe
- Mute
- Subscribe to RSS Feed
- Permalink
- Report Inappropriate Content
the first chart on the qvw file (att by you) is exacly what you are asking for
isn't it?
i cant find the problem you've got:/
- Mark as New
- Bookmark
- Subscribe
- Mute
- Subscribe to RSS Feed
- Permalink
- Report Inappropriate Content
image 2
only looks like the expression is missing (becouse the expression generate the same result)
check it by changing this chart from line chart to straight table
- Mark as New
- Bookmark
- Subscribe
- Mute
- Subscribe to RSS Feed
- Permalink
- Report Inappropriate Content
thanks for your reply Pari,
the first chart is what i am after. see below:

but it was created limiting each line using a separate expression using the following
for the total:
SUM({$ <Life = {"*"} >} ExtGSV$)
for each line:
Sum({$ <Life = {'A(<50%)'} >}ExtGSV$)
Sum({$ <Life = {'B(50-70%)'} >}ExtGSV$)
Sum({$ <Life = {'C(70-85%)'} >}ExtGSV$)
Sum({$ <Life = {'D(>85%)'} >}ExtGSV$)
however doing it this way it will not be possible to drill-down clicking on each line and this is a problem.
I would like to be able to obtain the same result using a single expression to display the 4 lines for (LIFE) using this Sum(ExtGSV$)
and add another expression for the total. i have tried using SUM({$ <Life = {"*"} >} ExtGSV$) but as mentioned it doesn't work.
In my example on the second bottom chart if you disable the first expression (Total GSV$) you will see the 4 lines appear correctly but when i try to get the 5th line with the total it doesn't work.
hope you can better understand me.
thanks
- Mark as New
- Bookmark
- Subscribe
- Mute
- Subscribe to RSS Feed
- Permalink
- Report Inappropriate Content
you did't say you want to drill down before:)
if you want to drill down you should prepare group dimension
you wrote:
"
for the total:
SUM({$ <Life = {"*"} >} ExtGSV$)
for each line:
Sum({$ <Life = {'A(<50%)'} >}ExtGSV$)
Sum({$ <Life = {'B(50-70%)'} >}ExtGSV$)
Sum({$ <Life = {'C(70-85%)'} >}ExtGSV$)
Sum({$ <Life = {'D(>85%)'} >}ExtGSV$)
however doing it this way it will not be possible to drill-down clicking on each line and this is a problem.
"
can you answer what you want to see after "drill-down clicking on each line"?
- Mark as New
- Bookmark
- Subscribe
- Mute
- Subscribe to RSS Feed
- Permalink
- Report Inappropriate Content
clicking on each line should create an equivalent of a selection and therefore if i click on one line will filter/display data in other objects based on the selection. For example if i click on the green line it shall filter by 'Life D(>85%)'.
If i use the following as in my example won't work.
for the total:
SUM({$ <Life = {"*"} >} ExtGSV$)
for each line:
Sum({$ <Life = {'A(<50%)'} >}ExtGSV$)
Sum({$ <Life = {'B(50-70%)'} >}ExtGSV$)
Sum({$ <Life = {'C(70-85%)'} >}ExtGSV$)
Sum({$ <Life = {'D(>85%)'} >}ExtGSV$)
thanks